Your Redis slowlog
rolled over. Again.
BetterDB persists your Redis slowlog, command history, and client analytics - so you can debug incidents hours later, not just right now. Works across Redis, Valkey, cloud, and self-hosted, with migrations in any direction.
Or self-host:
See what's actually happening inside your Redis instance
Historical data that survives a log rotation. Client-level attribution. Automatic anomaly detection.
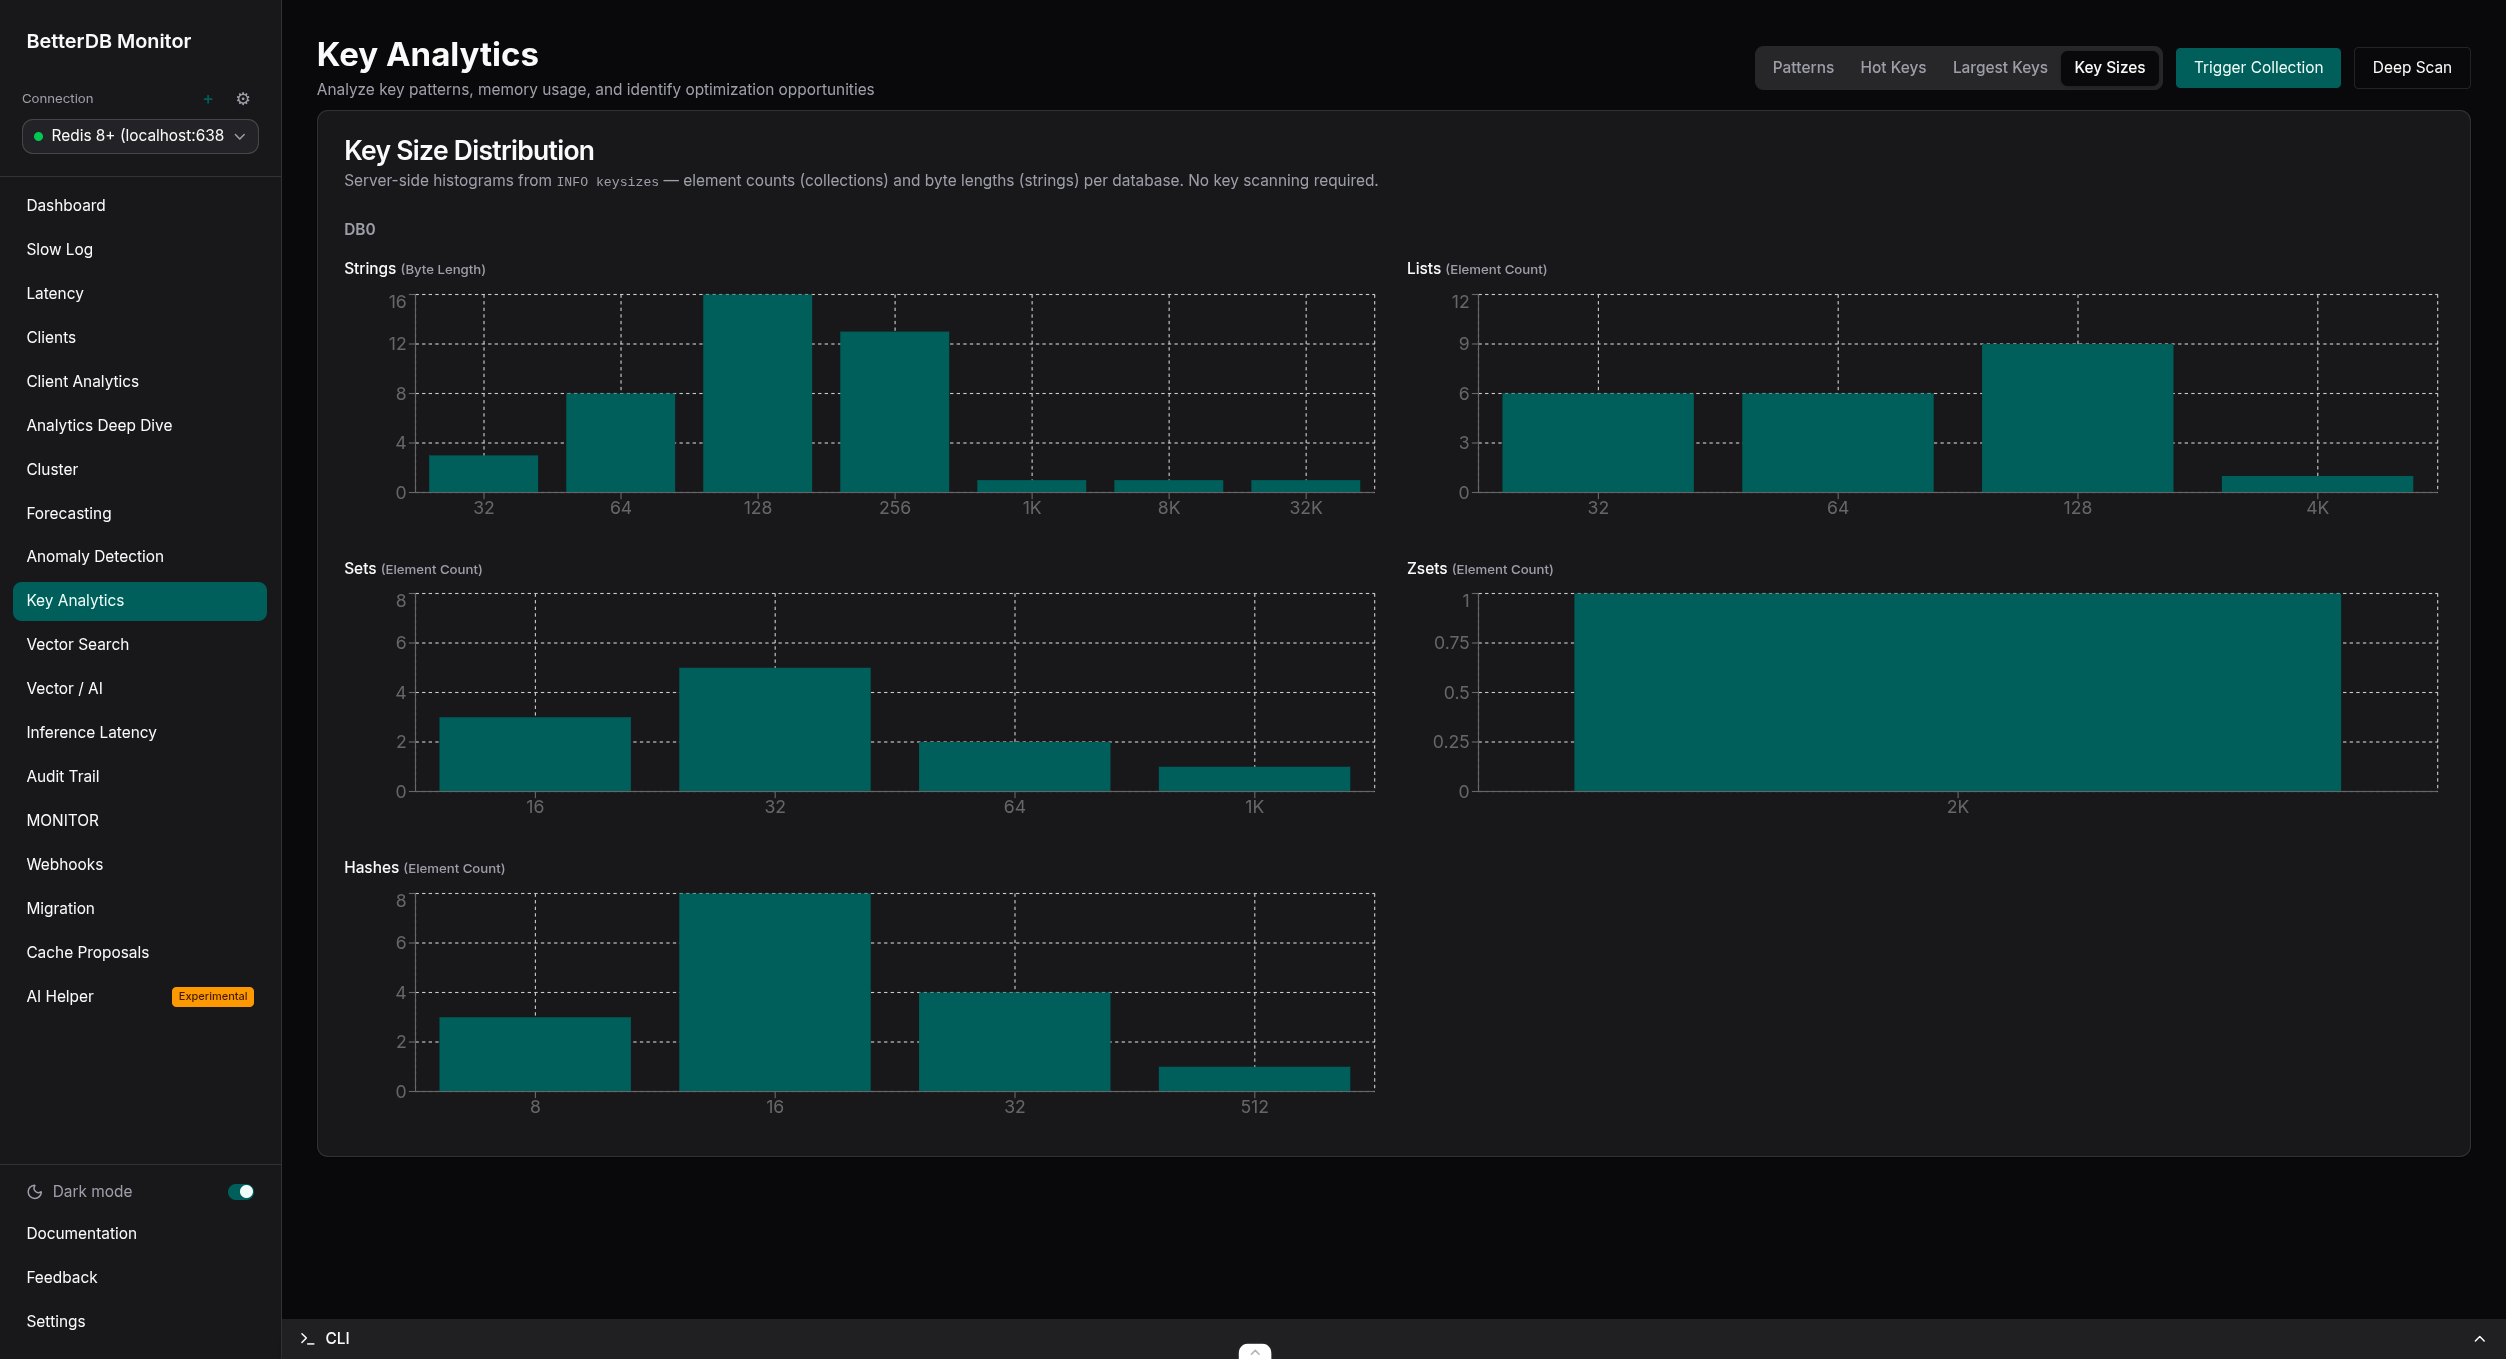
Key size distribution built from server-side INFO keysizes histograms - element counts for collections and byte lengths for strings, per database. No key scanning required.
Everything you need to understand your Redis instance
Deep insights with minimal overhead. Works with Redis today, Valkey-ready when you migrate.
Everything you need to understand your Valkey or Redis instance
Deep insights into your Valkey or Redis deployment with minimal overhead.
Air-Gapped Deployment
Runs fully offline in air-gapped environments. Offline license tokens are verified locally - no internet access needed, nothing leaves your network.
Anomaly Detection
Automatic detection of unusual patterns across memory, CPU, and connections - plus cluster safety guards for split-brain, stuck replicas, and data loss.
See every pattern →Historical Analytics
Query what happened at 3am, not just what's happening now.
Cluster Visualization
Interactive topology graphs, slot heatmaps, and migration tracking.
ACL Audit Trail
Track who accessed what for compliance and debugging.
Slowlog & COMMANDLOG
Pattern analysis across persisted slow queries and full command history. Valkey 8.1+ COMMANDLOG captures every command, not just the slowest ones.
Key Analytics
Analyze key patterns by namespace and key type.
Client Analytics
See which clients consume resources. Detect unusual buffer sizes and connection spikes.
Prometheus & OpenTelemetry
100+ Prometheus metrics, OTLP ingest and dispatch - send BetterDB data to your stack, or bring your traces in. Plus webhook alerts.
Vector Workload Analytics
FT.SEARCH ops/sec and latency over time, per-index health with alerts for indexing failures, backfill progress, and deleted-doc growth. Built for teams running RAG and semantic search in production.
Vector Search
Inspect vector indexes, browse embeddings, and find semantically similar entries with similarity scores.
Cache Proposals
Proposal queue and audit trail for agent-submitted cache optimizations. Review, edit, and approve threshold and TTL changes directly in BetterDB Monitor.
MCP Server
Full observability and cache intelligence tools from any MCP-compatible client - Claude Code, Cursor, IDEs. Agents read cache state and propose optimizations directly.
View on registry →Inference Pipeline Latency
Per-operation P50/P95/P99 profiles for FT.SEARCH, reads, and writes. Per-index SLA thresholds with webhook breach alerts - know before users do.
Hot Key Tracking
Top-50 keys by access frequency with rank movement over time. Spot what's climbing before it becomes a bottleneck.
MONITOR Capture Sessions
On-demand MONITOR captures with live tail, filters, and value redaction. Trigger on anomalies, schedule with cron, diff two captures, and export JSON or CSV.
Latency Monitoring
Per-event latency history across P50/P95/P99. Know when your instance started slowing down, not just that it is.
CPU & I/O Threads
Per-thread I/O metrics and CPU utilization charts, including Valkey 8.x I/O thread breakdowns.
Migration
Analyze compatibility, move data, and validate results across Redis, Valkey, cloud, and self-hosted - in any direction.
Throughput Forecasting
Growth rate trend and ceiling-based ops/sec forecasting. Get alerted before you hit capacity, not after.
Built for humans and agents alike
Investigate incidents yourself with a full UI - or point your agent at BetterDB and walk away.
You investigate
Full dashboard, slowlog pattern analysis, anomaly detection, client attribution, and vector search - everything you need to find what went wrong and why, with data that persists beyond the log rotation.
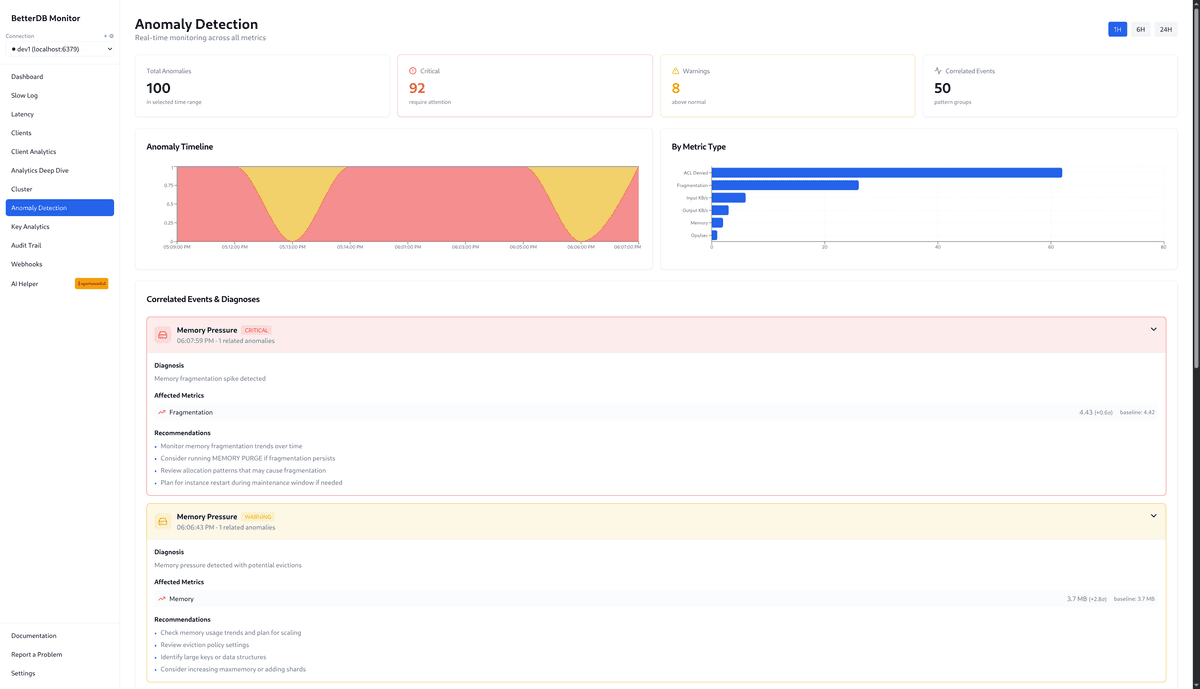
Your agent investigates
Connect BetterDB's MCP server to Claude Code, Cursor, or any MCP-compatible client. Ask questions in plain language. Get back structured diagnostics - slowlog history, anomaly summaries, latency trends, ACL audit - without opening a browser.
{
  "mcpServers": {
    "betterdb": {
      "command": "npx",
      "args": ["-y", "@betterdb/mcp"]
    }
  }
}Our goal: zero Redis hacks
If you've ever written a custom script, stitched together three tools, or just accepted that something wasn't observable - we want to hear about it. Tell us what's missing. We'll build it, and the next person won't have to figure it out themselves.
Book 15 min with KristiyanPrefer email? kristiyan@betterdb.com
Evaluating a move from Redis to Valkey?
BetterDB is the only monitoring tool that works across both — and gives you Valkey-native visibility (COMMANDLOG, per-thread I/O, SLOT-STATS) that no Redis tool can provide.
Learn about Valkey monitoring →Ready to get started?
Start monitoring in minutes - no infrastructure to maintain. Team collaboration, agent-based monitoring for private databases, and more. Or self-host - open source core, zero lock-in.