Two-tier caching for RAG: what we measured building chat.betterdb.com
I built a RAG chatbot over Valkey, Redis, and Dragonfly docs in a weekend, expecting to find that semantic caches silently corrupt answers when entity-swap queries collide. The data showed the opposite. Here is what we measured, what the architecture looks like, and where the real failure mode lives.
A few weekends ago I built a public RAG chatbot trained on the documentation of three RESP-compatible databases - Valkey, Redis, and Dragonfly - with full caching infrastructure underneath and live observability on every turn. The chatbot is at chat.betterdb.com if you want to poke at it. The point of the exercise was partly to ship a useful demo and partly to test a hypothesis I had been carrying around for months about how semantic caches silently corrupt answers in production.
The hypothesis was clean. Two queries one word apart - "Does Dragonfly support WAIT?" vs "Does Valkey support WAIT?" - would land in embedding space close enough that a typical 0.95 similarity threshold would treat them as the same query. The cache would confidently serve the Valkey answer to whoever asked about Dragonfly. Cache poisoning. Silent corruption. The kind of failure mode that a user has no way to detect because the wrong answer still looks plausible.
I spent the weekend building the chatbot, wired up tier 1 KV caching, tier 2 semantic caching with text-embedding-3-small, and a per-turn observability panel that showed every cache hit, every miss, every similarity score. By Sunday I also had a script measuring real cosine similarity numbers against the actual model. The hypothesis turned out to be wrong. Not partially wrong, not directionally wrong - flatly wrong on this model. And the real failure mode that fell out of the data is more interesting than the one I expected to find.
This post walks through the architecture I shipped, what the measurements actually showed, and where the dangerous case lives once you stop assuming and start instrumenting.
The architecture
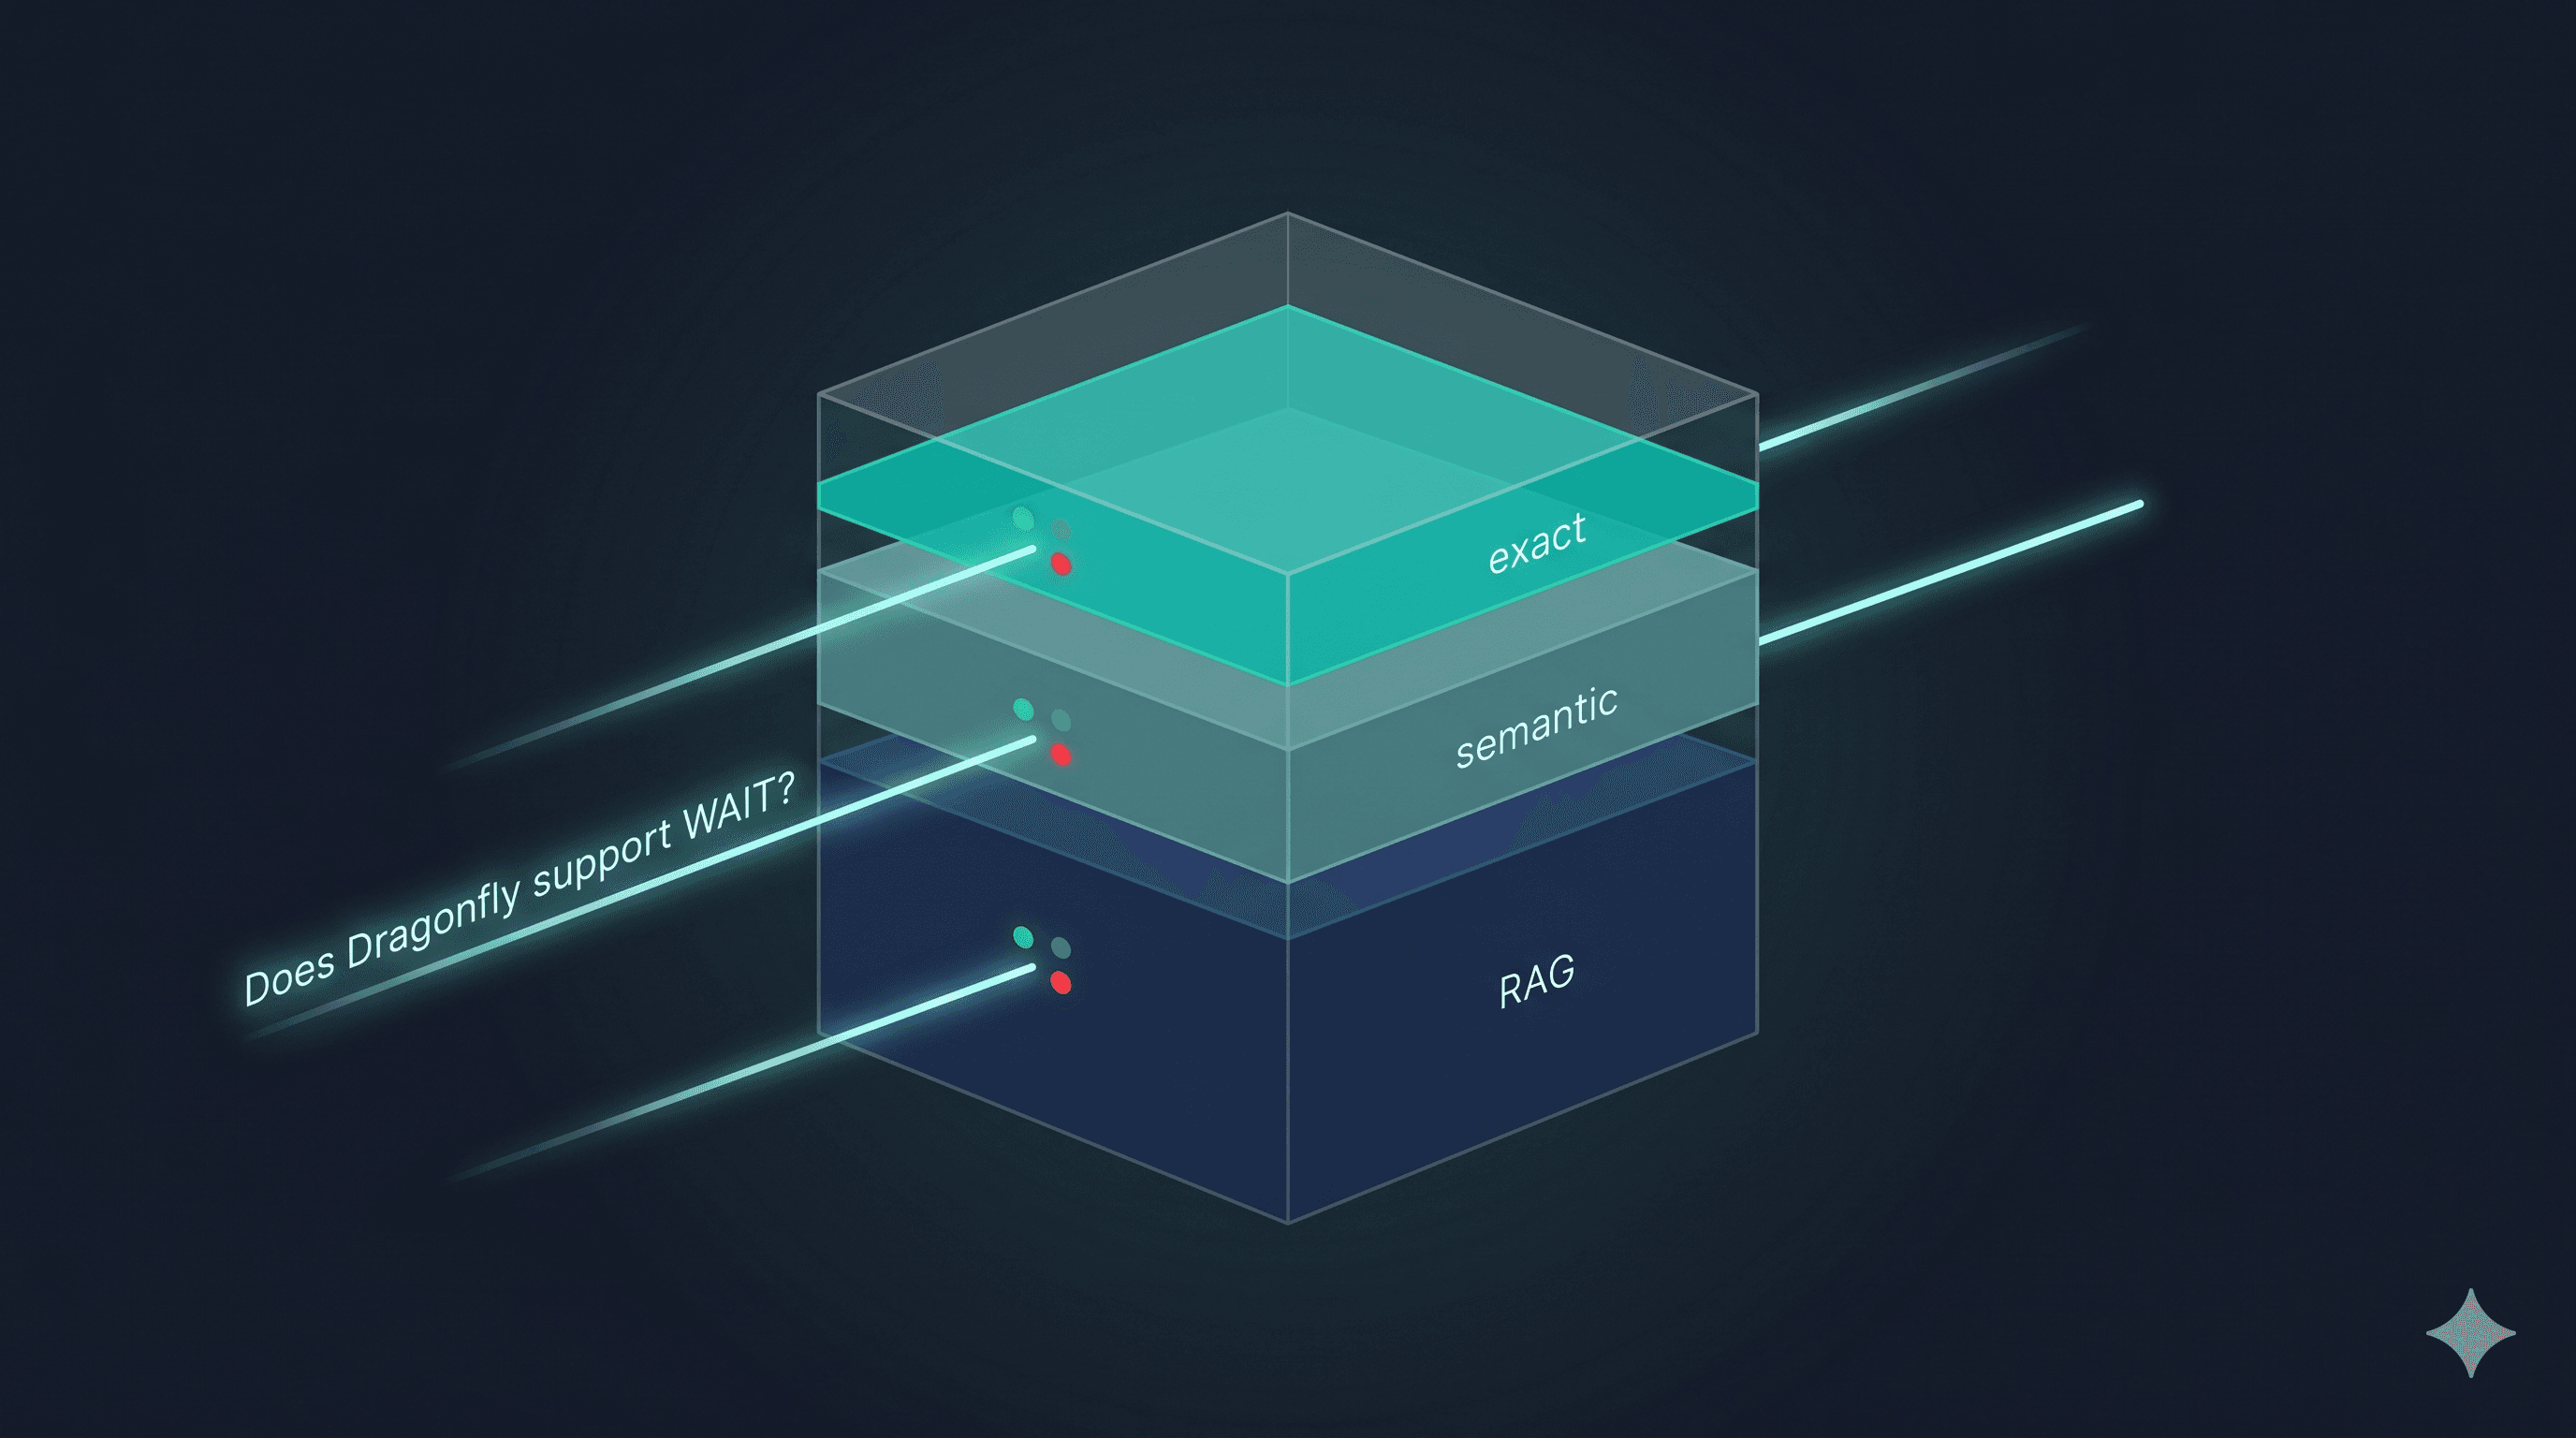
The cache stack underneath chat.betterdb.com has three tiers.
Tier 1 is an exact-match KV cache keyed by the normalized query string. Sub-millisecond lookup. No embeddings. If the query has been seen verbatim before - agent retries, polling, copy-pasted documentation questions - it returns the cached answer immediately and does not go further.
Tier 2 is a semantic cache consulted only on tier 1 miss. The query gets embedded with text-embedding-3-small, compared against stored query embeddings via cosine similarity, and returns the cached answer if the score is above a configured threshold.
Tier 3 is the actual RAG pipeline. Only consulted on tier 2 miss. Retrieve from a Valkey-backed vector store using valkey-search, generate an answer, store the result back into both caches.
The reason this stacks instead of collapsing into a single semantic cache is that real traffic has two different shapes of repetition that need different treatment.
Shape one is machine-generated repetition: agents retrying tool calls with identical arguments, polling loops, copy-pasted questions. This produces byte-identical query strings and the cache hit on it should be trivially cheap. Paying for an embedding lookup on every retry is pure waste.
Shape two is human paraphrase: the same intent expressed in different words. "What is Valkey?" vs "Tell me about Valkey." vs "Explain Valkey to me." Same answer, three different strings. This needs semantic matching to catch.
Tier 1 handles shape one cheaply and correctly by construction. Tier 2 handles shape two when the embedding model cooperates. Tier 3 only runs when both have legitimately failed. Each tier has a clear job and a clear cost profile, and the layers do not compete for the same hits.
What the chatbot looked like once it was running
After a few hundred queries through the deployed chatbot, the combined hit rate stabilized around 71%. Tier 1 caught a meaningful share of those - agent retries, repeated questions from the same session, the suggested-question chips that pre-warm the cache. Tier 2 caught the remaining hits, which were mostly paraphrases. Tier 3 ran only when neither tier had a usable answer.
The latency profile is where the cache earned its keep. Tier 1 hits returned in under 5ms. Tier 2 hits returned in roughly 100ms, dominated by the embedding call. Tier 3 misses took 2-10 seconds depending on the model. At chatbot scale, the per-turn dollar savings were unimpressive - fractions of a cent - but the latency compounded into something users actually noticed.
If you are not running a tier 1 cache in front of a tier 2 cache, you are paying for an embedding lookup on every machine retry. That is the most common configuration I see in the wild and it is pure waste at any scale.
Hunting for the cache poisoning case
With the chatbot running and the observability panel showing live data, I sat down to confirm my hypothesis about silent corruption. The plan was simple: write a script that fed text-embedding-3-small a set of entity-swap query pairs and check how many of them landed above the 0.95 threshold I had configured for the cache.
The script tested 28 query pairs. Twenty-four were entity-swap pairs - the same question structure with one database name swapped for another, organized by query shape (definition, configuration, cluster/scaling, feature support, command-level, comparison, performance). Four were paraphrase pairs as a sanity check, asking the same question in different words with no entity change.
The full results, sorted by query class:
Entity-swap pairs (n=24)
| Q1 | Q2 | Cosine |
|---|---|---|
| What is Redis? | What is Valkey? | 0.1507 |
| What is Valkey? | What is Dragonfly? | 0.2186 |
| What is Redis? | What is Dragonfly? | 0.2435 |
| Tell me about Valkey. | Tell me about Dragonfly. | 0.3483 |
| How fast is Redis? | How fast is Dragonfly? | 0.4438 |
| How does Redis cluster work? | How does Valkey cluster work? | 0.4656 |
| Does Redis support transactions? | Does Valkey support transactions? | 0.4956 |
| Does Redis support streams? | Does Valkey support streams? | 0.5169 |
| What is the default port for Redis? | What is the default port for Valkey? | 0.5404 |
| What are the differences between Redis and Valkey? | What are the differences between Redis and Dragonfly? | 0.5734 |
| What is the memory overhead of Redis? | What is the memory overhead of Valkey? | 0.5808 |
| Does Redis support Lua scripting? | Does Dragonfly support Lua scripting? | 0.6026 |
| How do I migrate from Redis to Valkey? | How do I migrate from Redis to Dragonfly? | 0.6009 |
| How does Redis handle failover? | How does Valkey handle failover? | 0.6070 |
| How do I set up replication in Redis? | How do I set up replication in Dragonfly? | 0.6192 |
| How do I use SCAN in Redis? | How do I use SCAN in Dragonfly? | 0.6230 |
| Does Valkey support pub/sub? | Does Dragonfly support pub/sub? | 0.6240 |
| How do I configure persistence in Valkey? | How do I configure persistence in Dragonfly? | 0.6263 |
| How do I configure persistence in Redis? | How do I configure persistence in Valkey? | 0.6264 |
| Does Dragonfly support WAIT? | Does Valkey support WAIT? | 0.6320 |
| What does the WAIT command do in Redis? | What does the WAIT command do in Valkey? | 0.6396 |
| How do I shard data in Redis? | How do I shard data in Dragonfly? | 0.6408 |
| Explain MULTI/EXEC in Redis. | Explain MULTI/EXEC in Valkey. | 0.6927 |
| How do I enable AOF persistence in Valkey? | How do I enable AOF persistence in Dragonfly? | 0.7391 |
Range: 0.1507 to 0.7391. Mean: ~0.547. Not a single pair crossed a generous 0.85 threshold. The lowest scores cluster around bare definition swaps ("What is Redis?" / "What is Valkey?") because the entity is essentially the entire query and the embedding has nothing else to anchor to. The highest scores cluster around configuration-style queries where the entity sits inside a longer surrounding context that dominates the embedding ("How do I enable AOF persistence in...") - but even those land well below any threshold a sane engineer would pick.
Paraphrase pairs (n=4, sanity check)
| Q1 | Q2 | Cosine |
|---|---|---|
| What is Valkey? | Explain Valkey to me. | 0.8139 |
| What is Valkey? | Tell me about Valkey. | 0.8442 |
| How do I install Redis? | What's the installation process for Redis? | 0.8830 |
| How does Redis cluster work? | Can you explain how Redis clustering works? | 0.9145 |
Range: 0.8139 to 0.9145. These are the legitimate hits - same intent, no entity change, different surface wording. They are exactly the cases semantic caching is supposed to catch. And they are sitting in a band where threshold tuning actually decides whether the cache fires.
The full 28-pair script and raw output are in the chatbot repository at github.com/BetterDB-inc/playground.
What this looks like across the score distribution
Plotted on a single 0-to-1 axis, the two classes separate cleanly:
0.0      0.2      0.4      0.6      0.8      1.0
|--------|--------|--------|--------|--------|
                                     [PARAPHRASES]
                                     0.81 -- 0.91
                                     |||||
         [ENTITY SWAPS]
         0.15 ---------------- 0.74
         ||||| |||||||||||||||||
         |________________| ___| _________
              dense cluster      separator
              0.44 - 0.69        gap (~0.07)
                                 0.74 -> 0.81
There is roughly a 0.07-wide gap between the highest entity-swap pair (0.7391) and the lowest paraphrase pair (0.8139). That gap is where a well-chosen threshold lives. On this data, anywhere from 0.75 to 0.81 separates the two classes perfectly - but 0.75 is much lower than typical industry advice (0.85-0.95), and dropping the threshold that far in production introduces risk against query distributions that are not in this 28-pair sample.
The hypothesis assumed entity swaps would cluster in the 0.92+ dangerous zone. They did not. Across 24 pairs, the highest entity-swap similarity I measured was 0.7391, well below any reasonable cache threshold. The "Does Dragonfly support WAIT?" example I had been mentally rehearsing for months landed at 0.6320, not even close to the threshold.
In other words: text-embedding-3-small handles entity disambiguation between Redis, Valkey, and Dragonfly genuinely well. The model has learned that swapping a database name in a technical question produces a meaningfully different query. The dramatic cache-poisoning failure mode I expected to find does not exist on this model.
The paraphrase pairs were the surprise. "What is Valkey?" vs "Tell me about Valkey." sits at 0.8442. "What is Valkey?" vs "Explain Valkey to me." sits at 0.8139. These are the exact case semantic caching is supposed to catch - same intent, different words, no entity change. They are the legitimate hits. And they are sitting just below or just above the 0.85 threshold, in the band where threshold tuning actually decides whether the cache fires.
The actual failure mode
What this data describes, once the dramatic version is gone, is a much more boring and much more practical problem.
If you set your threshold at the commonly-recommended 0.95, the cache misses every entity swap (good - they need different answers) but also misses most legitimate paraphrases (bad - those are exactly what semantic caching is supposed to catch). If you drop the threshold to 0.85 to catch paraphrases, you catch some of them but the borderline cases at 0.81-0.83 still leak through, and you have moved closer to whatever false-positive risk lives in that band.
There is no single threshold that catches all paraphrases without false positives. The threshold you pick determines which paraphrases you give up on. The dangerous failure mode is not "your cache is lying to your users." It is "your cache is missing more legitimate hits than you realize, and you are paying for tier 3 retrievals you should not be."
This maps directly to what the chatbot's observability panel was showing. Most of the hits were tier 1, which makes sense - agents and retries dominate machine traffic. The tier 2 hits that did fire were typically high-confidence paraphrases sitting above 0.90. The interesting question was always what happened to the queries that landed at 0.83 or 0.86 - borderline cases where a small threshold change would have flipped the outcome. Without instrumentation showing the score distribution on near-misses, you cannot answer that question. With instrumentation, the answer becomes obvious within a few hundred queries.
Five ways to address the borderline band
The interesting band, on this model and this data, is 0.80-0.92. Below 0.80, the cache misses anyway. Above 0.92, a sane threshold lets it through. The architectural question is what to do about legitimate paraphrases that fall in between.
Lower the threshold. Drop from 0.95 to 0.85 and you catch more paraphrases. You also start risking false positives on whatever lives in that band. On text-embedding-3-small for the Redis/Valkey/Dragonfly fork problem this is mostly fine - entity swaps cluster well below 0.85 - but the same threshold drop on a different model or a different domain may not be safe.
Per-namespace caches. Partition the cache by detected entity. A query mentioning Dragonfly only checks against cached Dragonfly queries. Useful when your domain has a small set of high-value entities that drive most of the disambiguation. Requires named-entity recognition at query time, which is itself a model call, and it fails on queries that do not name the entity ("does WAIT work here?").
Query rewriting before embedding. Use a small fast model to canonicalize the query - resolve pronouns, expand abbreviations, name implicit subjects - before computing the embedding. This pulls borderline paraphrases up into hit range by stripping surface variation. Adds latency back to tier 2.
Ensemble matching. Compute similarity in multiple embedding spaces and require agreement. Catches some borderline hits the single embedding misses. Doubles your embedding cost. The failure modes still exist - they just relocate.
LLM as judge. On a tier 2 candidate match in the borderline band, ask a small fast model whether the cached answer actually applies to the new query. The judge sees both queries plus the cached answer and returns yes or no. This is the only fix that changes the shape of the problem rather than relocating it. LLMs handle intent-level distinctions that embedding similarity flattens, which is exactly the pattern the borderline band is producing. Cost is one cheap model call (~200-400ms, sub-cent on a 4o-mini or Haiku class model) on every borderline candidate. That is still dramatically cheaper than a tier 3 miss.
For low-stakes caches, the honest answer is to pick a threshold and accept the miss rate. For caches where every uncaught paraphrase is a tier 3 retrieval you did not need to pay for, wire up a judge specifically for the 0.80-0.92 band. The judge does not run on high-confidence hits and does not run on confident misses. It only runs on the borderline candidates, which keeps the additional latency and cost contained to the cases where it actually changes outcomes.
What to instrument
The instrumentation in chat.betterdb.com is what made the weekend worth it. Without it, the cache would have been a black box and I would still be telling the dramatic-but-wrong story I started with. Here is the minimum that earns its keep in production.
Per-turn cache hit/miss for each tier, with the similarity score recorded on tier 2 candidates. The cached query that matched, or in the case of a near-miss the cached query that almost matched, so you can audit borderline cases after the fact. Latency saved per hit, computed against the rolling average miss latency. Tokens and dollars saved per hit, computed against the per-model rate card. And - the most important one - the distribution of similarity scores on near-misses, so you can see what is sitting just below your threshold.
Expose all of it as OpenTelemetry spans and Prometheus metrics. You get tracing, alerting, and dashboards for free, and you can answer questions about cache behavior without writing custom queries.
The interesting metric is not the hit rate. Hit rate is a vanity number. The interesting metric is the distribution of similarity scores on near-misses. If a fat cluster sits at 0.82-0.84 just below your 0.85 threshold, those are paraphrases you are paying full price for when you should not be. Lower the threshold or wire up a judge for that band.
For agent traffic specifically, instrument tool call results separately from LLM responses. They have different repetition profiles. Tool calls repeat near-identically because agents are deterministic in argument generation. LLM responses repeat by paraphrase because users are not. Caching them with the same configuration is leaving wins on the table.
Session state changes the cache key
There is a third thing worth caching that does not fit cleanly into either tier: agent session state. Conversation history, partial reasoning trace, intermediate scratchpad. Not really a cache in the usual sense - more a checkpoint - but it shares enough infrastructure with the cache layer that it usually lives in the same store.
The relevant detail for the RAG case is that session state changes the cache key. "What is Valkey?" asked in turn 1 of a fresh session is not the same query as "What is Valkey?" asked in turn 7 of a session where the previous turns established that the user is asking about Dragonfly compatibility. The honest version of this stack treats conversation context as part of the cache key, at least at the semantic tier.
This is where you give up some hit rate for correctness. A tier 2 lookup that includes conversation context will match fewer cached queries because the context tokens drag the embedding around. But it stops the worst class of collision - the cross-session bleed, where one user's question gets answered with another user's prior context. For any AI product handling sensitive content (support tickets, financial questions, medical queries), this is non-negotiable. The performance hit is real but the alternative is a privacy incident waiting to happen.
What we ship
The Valkey ecosystem fits this caching pattern well because Valkey can hold all three pieces in one database - vector store via valkey-search, exact-match KV cache, and semantic cache - at sub-millisecond latency. One Valkey cluster, one set of credentials, one observability surface. There is no operational complexity from running three separate stores for what should be a single concern.
The libraries that wrap this pattern - @betterdb/agent-cache and @betterdb/semantic-cache, MIT-licensed on npm and PyPI - exist because assembling this from primitives is annoying. They ship with adapters for OpenAI, Anthropic, Bedrock, LangChain, LangGraph, LlamaIndex, and Vercel AI SDK (TypeScript only on the last one). OpenTelemetry and Prometheus instrumentation is wired in by default because retrofitting observability after the fact is the kind of thing nobody actually does.
The chatbot itself at chat.betterdb.com is open source. The cache libraries are open source. The schema, prompts, and similarity-measurement script are in the same repo. Fork it, point it at your own docs, run the script against your real query distribution. The dashboard will tell you what is actually happening in your borderline band, and that is the only data that matters for tuning.
Caveats
Everything in this post comes from one model and one chatbot's worth of data. text-embedding-3-small is well-calibrated for the Redis/Valkey/Dragonfly disambiguation problem in 2026. Other models behave differently and the entity-swap collision I expected to find may exist in your stack on text-embedding-ada-002, or on smaller sentence-transformer models, or on multilingual embeddings, or on any embedding model that was not trained on enough technical documentation to learn that database forks are distinct entities.
If you take only one operational thing from this post, take this: run the script against your own model and your own representative query pairs before you trust any threshold you read in a blog post. The architecture generalizes. The specific numbers do not.
What this changed for us
I went into Saturday morning with a clean story about silent corruption and confident wrong answers. I came out Sunday night with a different one. The dangerous failure mode is the boring one: not cache poisoning but cache under-performance, missing legitimate paraphrases that sit in the 0.80-0.92 borderline band. Threshold tuning is a knob, not an answer; the interesting work is deciding what to do about the borderline cases. The metric that drives decisions is not hit rate but the distribution of similarity scores on near-misses.
The reason I keep emphasizing the weekend timeframe is not that I am bragging about how fast we shipped. It is that the weekend is the point. Without building the chatbot, instrumenting it, and running the measurement script, I would have published the dramatic version of this post - the version with the 0.97 entity-swap collision and the confident wrong answers about cache poisoning. The dramatic version reads better and would have gotten upvotes. It would also have been wrong, on this model, and a few hundred engineers would have walked away with a confident wrong belief about how text-embedding-3-small handles entity disambiguation.
The thing that prevented that was not skepticism or intelligence. It was building the system and looking at what the dashboard actually showed. Once you have a working cache with live observability, you stop theorizing and start measuring. The numbers do not care about your hypothesis.
If you are building RAG infrastructure at any scale, the takeaway is straightforward. Build the simplest version of the stack that runs end-to-end. Instrument every layer. Run real queries through it. Measure the distribution of scores on hits and near-misses. Then decide what to tune. Caching is one of those areas where one weekend of measurement saves you six months of misconfigured production, and the misconfiguration almost always trends toward "missing legitimate hits you do not know about" rather than "serving wrong answers your users will catch."
Run your own pairs.