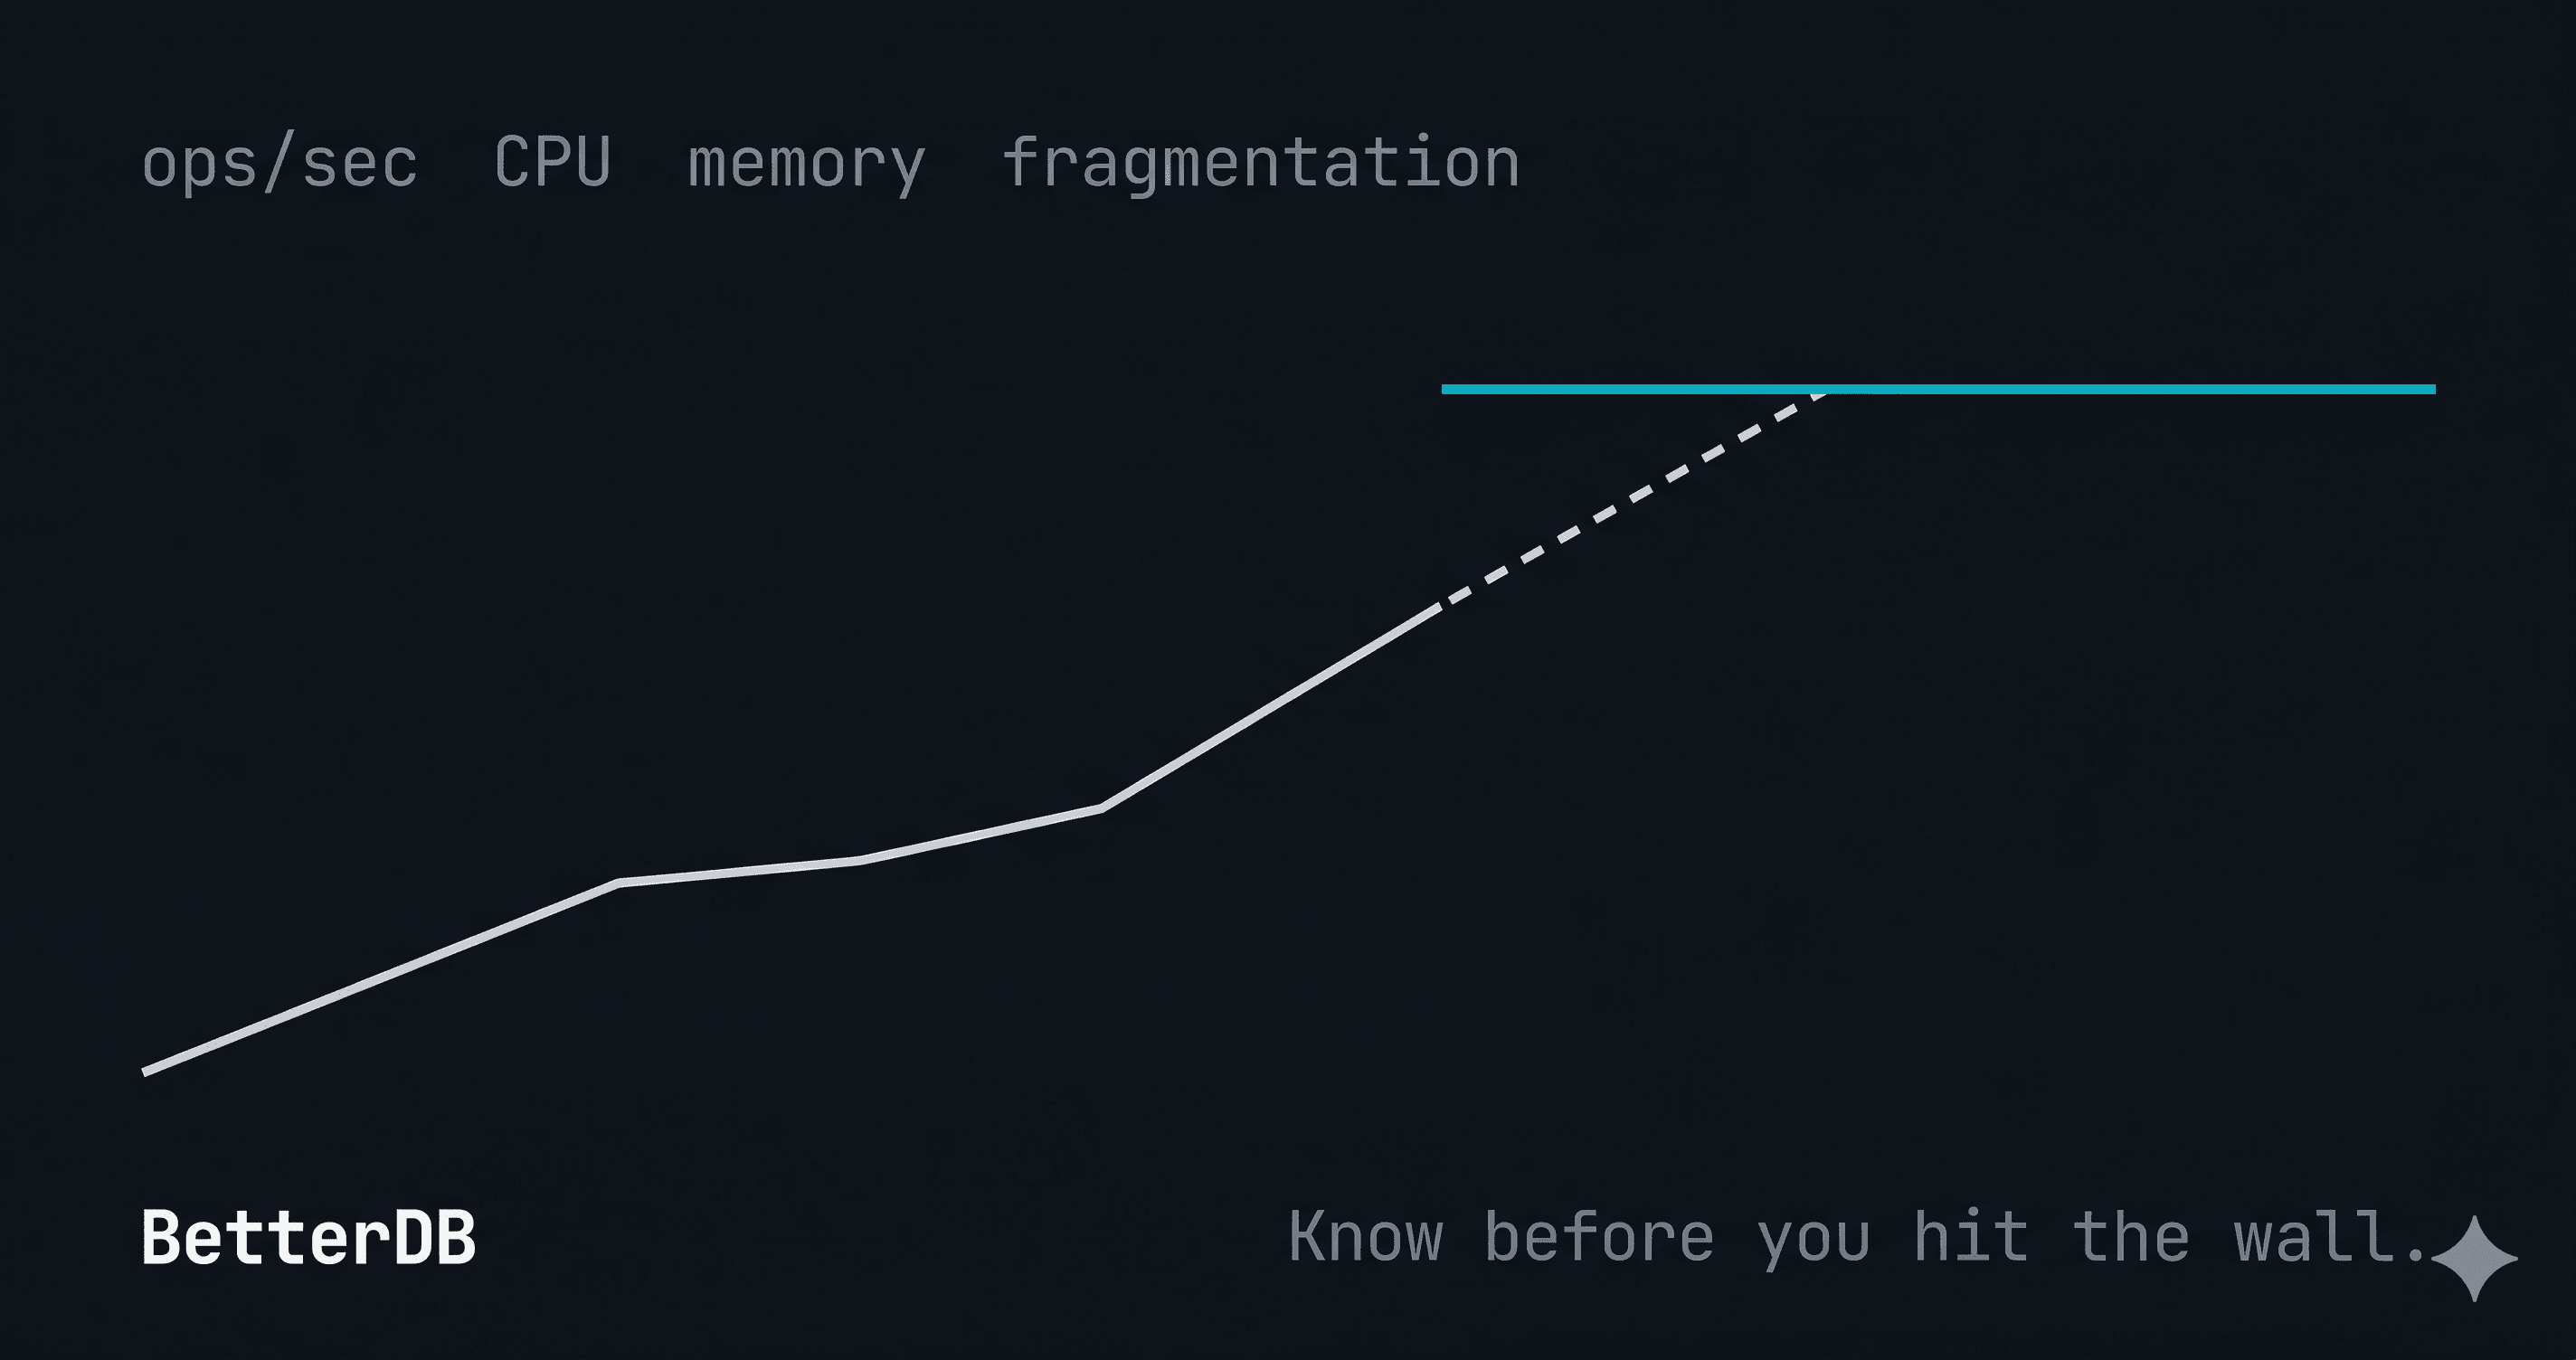
Know Before You Hit the Wall: Metric Forecasting in BetterDB
BetterDB now forecasts ops/sec, CPU, memory, and fragmentation - so you can see capacity problems coming before they become incidents.
Last week, BetterDB Cloud started getting traction. Registrations were climbing, new workspaces were spinning up, and everything looked healthy on the dashboard. Standard metrics, green across the board.
Then it stopped working.
We'd hit an AWS account-level resource limit. The kind that doesn't fire an alert - it just silently caps you. New tenants couldn't provision. Existing ones were unaffected. From the outside, everything looked fine. From the inside, we were dead in the water for new signups until we diagnosed it and raised the limit.
The frustrating part wasn't the limit itself. Limits exist, and raising them is a support ticket. The frustrating part was that nothing told us we were approaching it. We were watching the metrics we knew to watch - request rates, error rates, latency. Nobody was watching the metric that mattered: resource consumption trending toward a ceiling we didn't know we had.
That's the gap metric forecasting is designed to close.
Reactive monitoring isn't enough
Traditional monitoring answers one question: what is happening right now?
It's a necessary question. But it's the wrong question to ask if you want to avoid incidents instead of just respond to them faster. By the time a metric spikes into alert territory, you're already in the incident. The evidence is there, the damage is done, and you're debugging under pressure.
What you actually want to know is: where is this heading, and when do I need to act?
What gets forecasted
BetterDB now forecasts four metrics - the ones that determine whether your instance survives the next traffic event:
ops/sec - the raw throughput load on your instance. Growth here is the leading indicator of everything else. When ops/sec climbs steadily, CPU, memory, and connection pressure follow.
CPU utilization - Valkey processes commands on a single main thread, even with multi-threaded I/O in 8.0+. CPU pressure on that main thread is finite and non-negotiable. A forecast showing you crossing 70% in two weeks is a two-week runway to act. A spike crossing 90% at 2am is an incident.
Memory usage - the most common cause of unexpected evictions and latency spikes. Memory growth is often gradual and invisible until it isn't. Forecasting catches the slow creep that dashboards miss.
Fragmentation ratio - high fragmentation means your instance is consuming significantly more RSS (Resident Set Size - the actual physical memory allocated by the OS) than your data requires. Left unchecked it causes eviction under load even when your logical data size looks healthy. Forecasting fragmentation lets you schedule a MEMORY PURGE or review key TTLs proactively rather than reactively.
Two modes
Trend mode shows you the growth projection without a ceiling - where the line is heading if current conditions continue.
Forecast mode lets you configure a ceiling - your instance's practical limit for a given metric. BetterDB projects the current trend forward and tells you when you'll hit it. That's your runway.
Forecast breach alerts are available via webhook, so you can route a "you have 5 days of headroom" notification to Slack, ZenDuty, email, or wherever your team actually responds - before it becomes a 3am problem.
Why four metrics and not just one
Ops/sec alone doesn't tell the full story. A workload that's light on throughput but heavy on large value reads can saturate memory without ever spiking ops/sec. A Lua-heavy workload can spike CPU at moderate throughput. Fragmentation can degrade performance invisibly while every other metric looks fine.
Our own AWS situation is a good example of this. Throughput was healthy. Latency was healthy. The metric that was heading toward a wall - resource allocation - wasn't one we were actively watching. If we'd had forecast-based visibility on that constraint, we'd have seen it coming days earlier.
Forecasting one metric in isolation gives you one early warning signal. Forecasting all four together gives you a complete picture of which constraint you'll hit first.
The planning conversation it enables
The forecast isn't just an operational tool. It's a capacity planning artifact.
"When do we need to scale?" is a question every engineering team faces before every planning cycle. Without data, the answer is a guess. With a BetterDB forecast, you can show your team - or your manager - a projection with a concrete timeline attached.
We built this because we needed it ourselves. Turns out watching a trend line approach a ceiling is a lot less stressful than discovering you've already hit one.
Sign in to BetterDB Cloud or pull the Docker image to get started.