Introducing the BetterDB CLI: Run Valkey Commands Without Leaving Your Monitor
Stop switching tabs. BetterDB now includes an integrated CLI so you can investigate and act on what you see - without ever leaving the monitor.
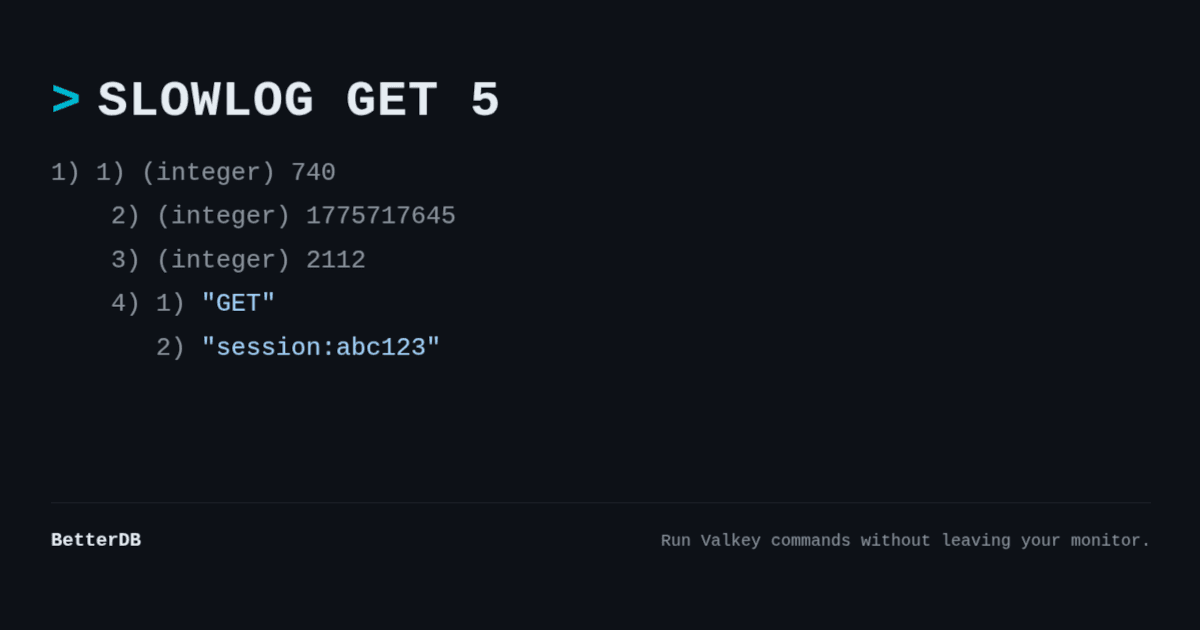
You're staring at a spike in the slowlog. A command you don't recognize, a client that shouldn't be there, memory climbing faster than it should. The next step is obvious - you need to run a command against the instance.
So you open a terminal, find your connection string, fire up valkey-cli, and by the time you're back in context, you've already lost the thread.
That's the workflow we just eliminated.
Meet the BetterDB CLI
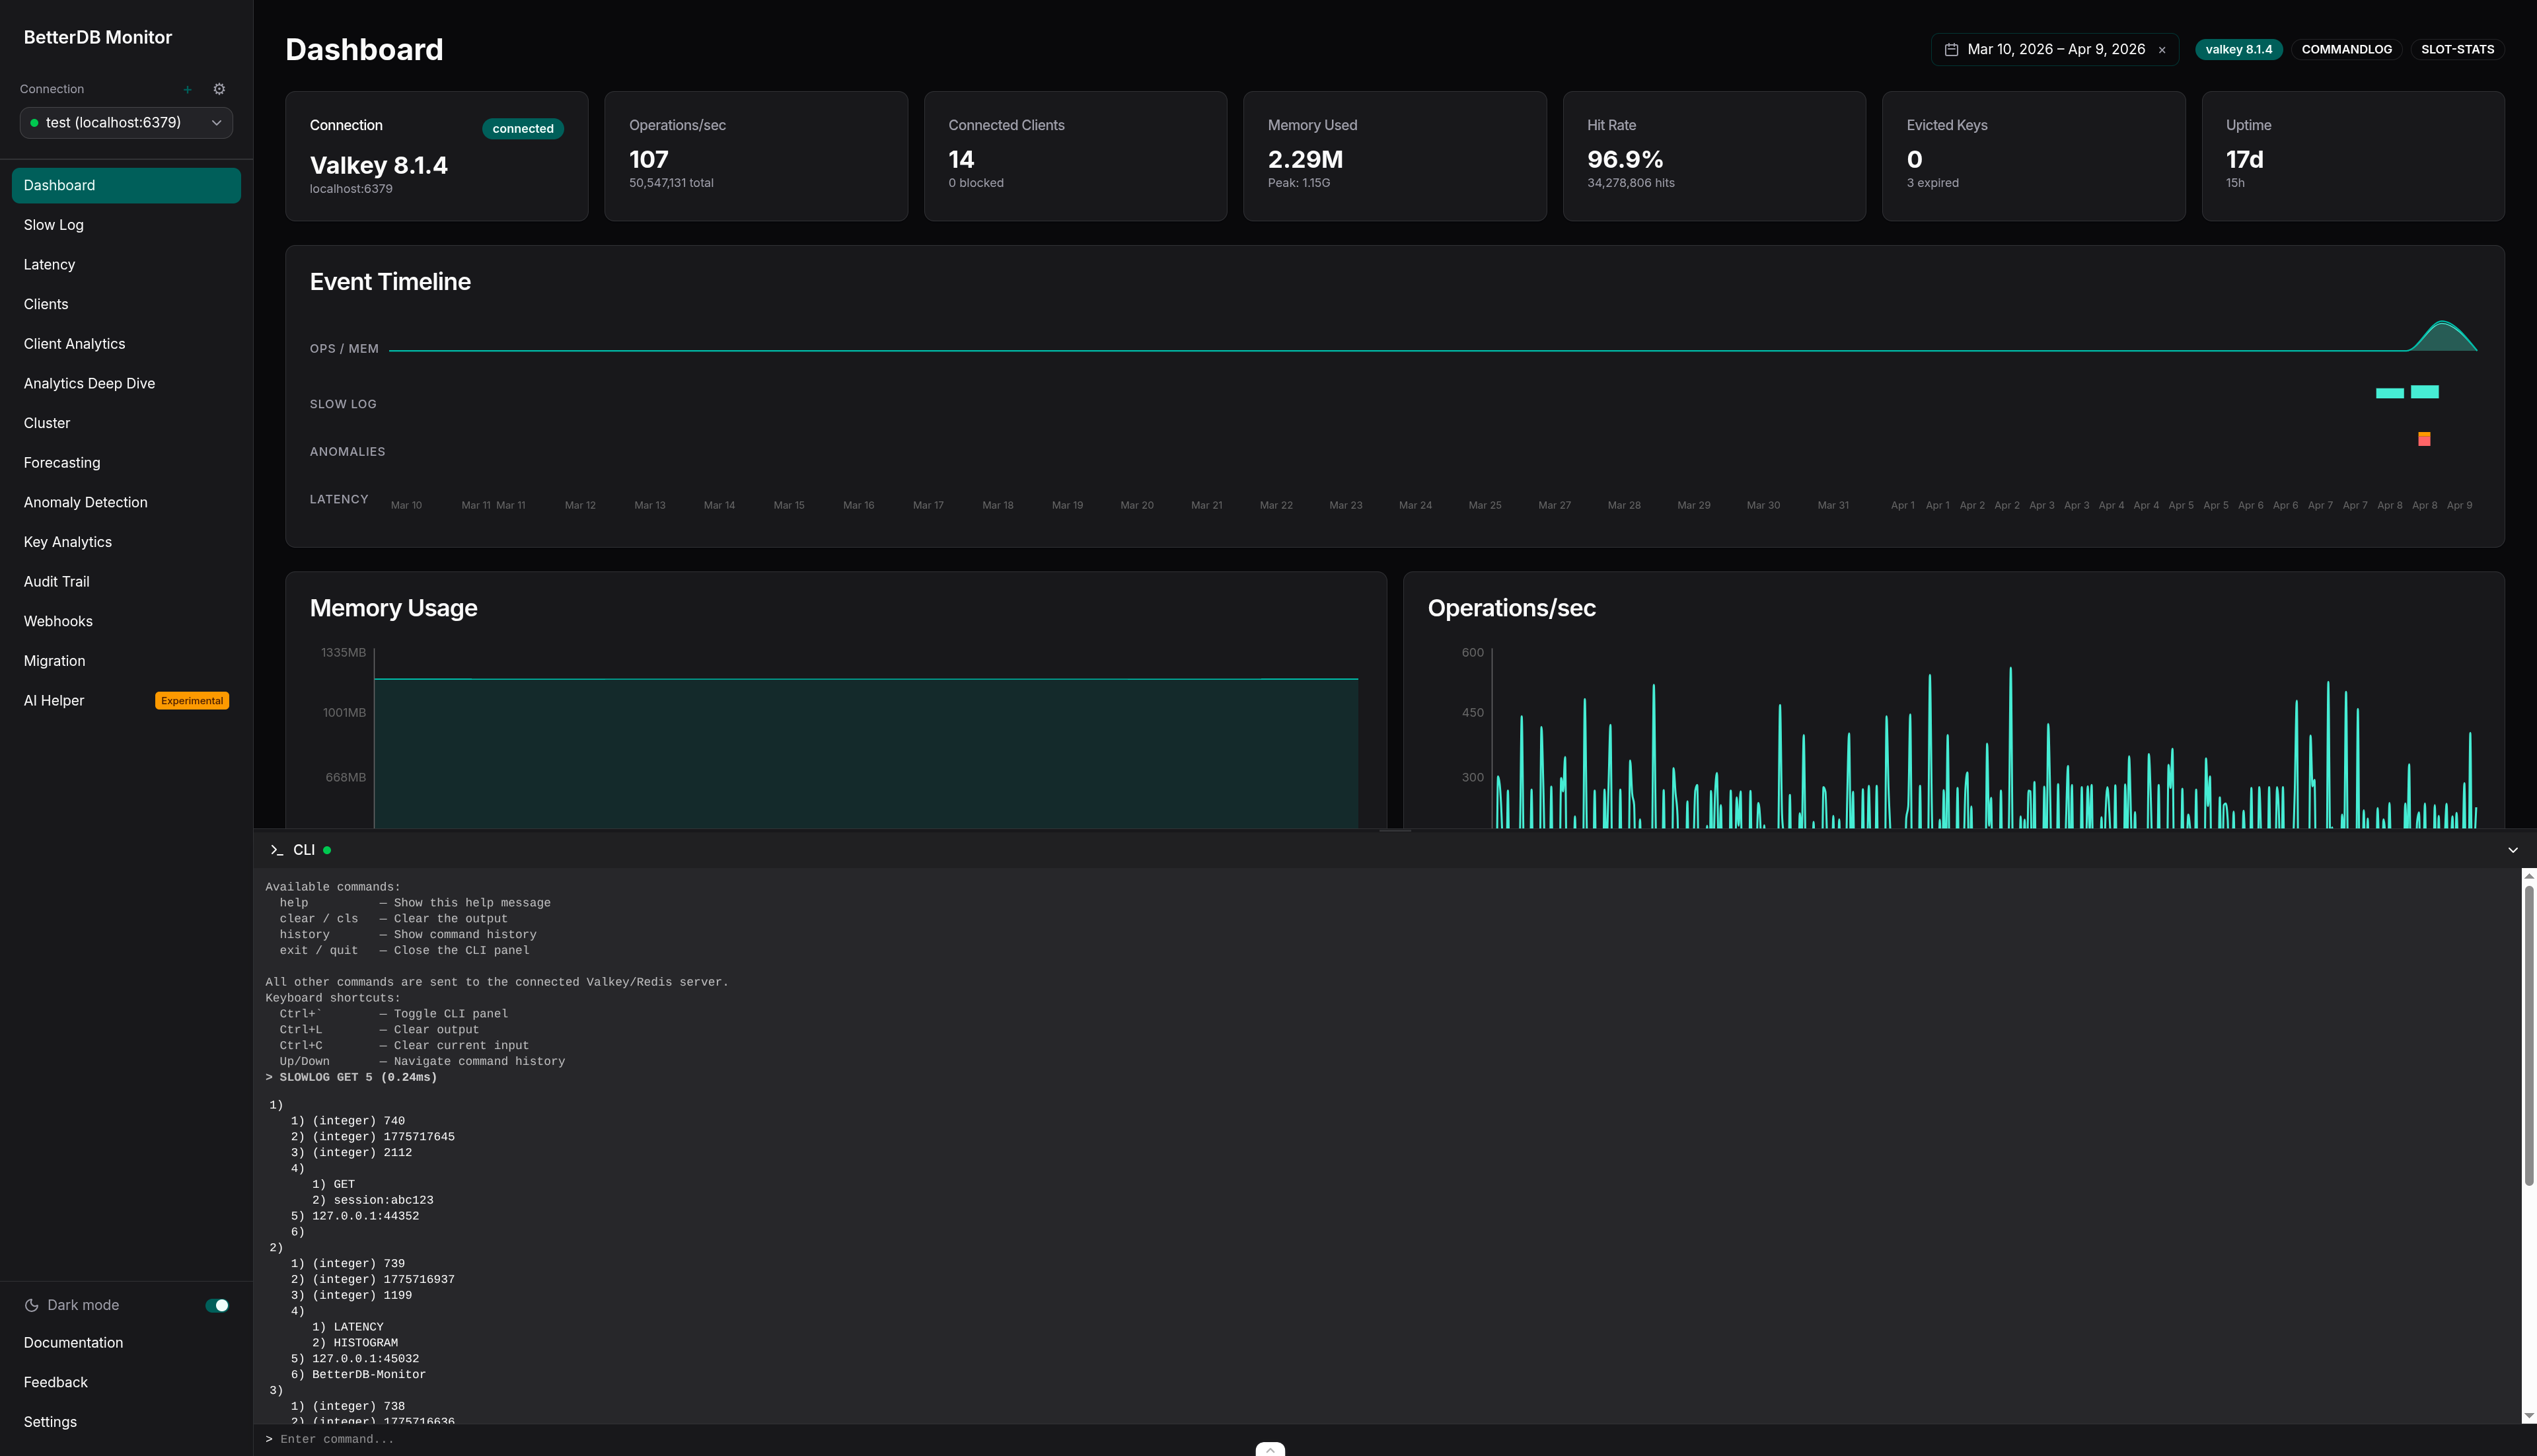
BetterDB Monitor now includes an integrated CLI - a full command panel built directly into the UI, right where you're already investigating.
Spot something in the slowlog? Open the CLI and inspect it. See an unusual key pattern in client analytics? Query it directly. No tab switching, no terminal juggling, no lost context. The investigation stays in one place, start to finish.
The panel opens at the bottom of the screen - the same interaction model you already know from VS Code. It uses your currently selected connection automatically, so there's no setup. Output is formatted exactly like valkey-cli: strings, integers, arrays, and nil values render the way you expect. Command history is a keypress away.
Under the hood, the CLI runs on a dedicated BetterDB-CLI connection, completely separate from your monitoring pipeline. Your investigation commands never interfere with the metrics being collected in the background.
Built with safety in mind
We didn't just add a terminal to a monitoring tool. We built a CLI that fits how monitoring actually works.
Read-oriented commands - INFO, PING, TTL, TYPE, OBJECT ENCODING, and the full diagnostic surface you'd reach for during an investigation - work out of the box, no configuration required. Because that's what you need 95% of the time.
When you do need to go further, set BETTERDB_UNSAFE_CLI=true to unlock write and destructive commands:
docker run -e BETTERDB_UNSAFE_CLI=true ... betterdb/monitor
A startup warning confirms unsafe mode is active. No ambiguity about what's allowed.
One hard limit regardless of mode: blocking commands like SUBSCRIBE, MONITOR, and BLPOP are always rejected. They don't fit the request-response model of an interactive panel - and that's by design.
Agent-connected instances: safety on both ends
Running Valkey inside your own VPC through the BetterDB agent? The CLI works there too - with one important detail.
Both the monitor and the agent need BETTERDB_UNSAFE_CLI=true to allow dangerous commands. The agent enforces its own safety boundary independently, because it runs inside your infrastructure and we think that's the right call.
# Monitor
docker run -e BETTERDB_UNSAFE_CLI=true ... betterdb/monitor

# Agent (inside your VPC)
docker run -e BETTERDB_UNSAFE_CLI=true ... betterdb/agent
If either side is missing the flag, dangerous commands are blocked. Opting out of safe mode requires a deliberate decision on both ends - and we're comfortable with that tradeoff.
The context switch is over
The best debugging tool is the one that keeps you in flow. Every time you switch windows, you lose a little of the mental model you've been building - what you saw, what you were about to check, what you suspected.
The BetterDB CLI keeps that model intact. You see something, you investigate it, you understand it - all in one place.
Sign in to BetterDB Cloud or pull the Docker image to try it today.