Debugging Valkey with MCP: When Your AI Can Query Your Monitoring
Why natural language access to Valkey observability data changes how incidents get investigated - and what it means for AI agents that use Valkey directly.
In a previous article, we walked through a MemoryDB incident three ways: CloudWatch, BetterDB UI, and BetterDB MCP. The MCP path was the fastest - four questions in plain English, no browser, complete root cause in under two minutes.
This article is about why that works, and what it implies beyond incident debugging.
The problem with dashboards
Dashboards are a good answer to a specific question: what is happening right now? Memory usage, ops/sec, hit rate - all of it at a glance.
Debugging is a different kind of question: what happened, to what, from where, and why? That's not a display problem. It's a retrieval problem.
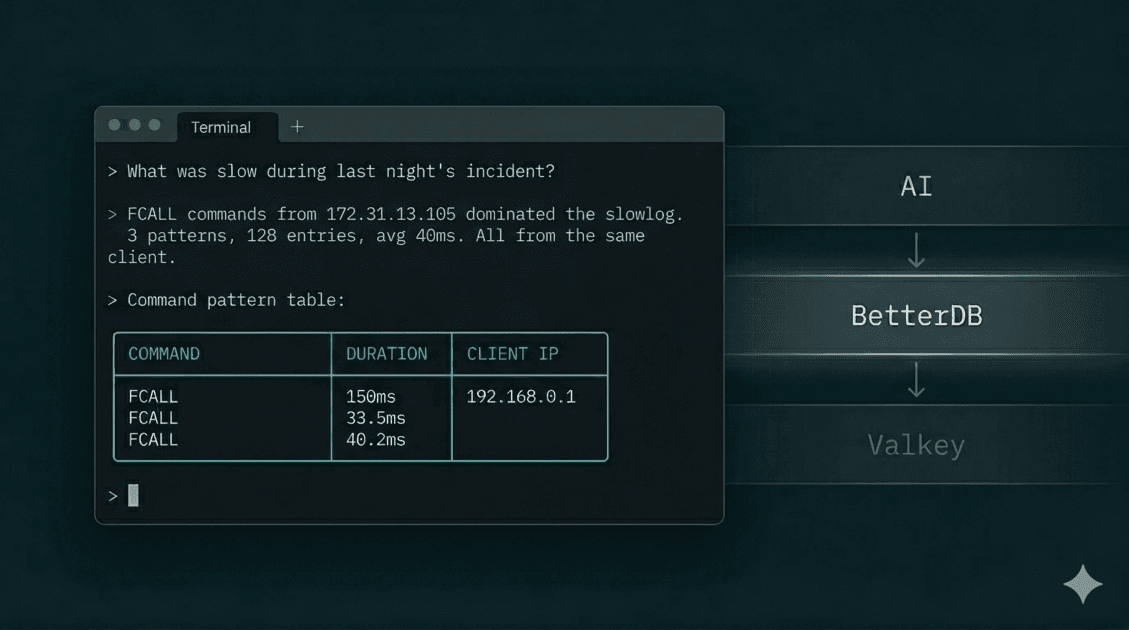
The data you need for post-incident forensics - slowlog entries, command patterns, client identities, key-level memory breakdown - is ephemeral. Valkey's in-memory slowlog holds 128 entries by default. Under load, that buffer rotates in minutes. By the time you open a dashboard, the evidence is gone.
BetterDB solves this by persisting that data continuously via a polling agent - so slowlog entries, COMMANDLOG data, and anomaly events are queryable hours after they occurred. The dashboard gives you the visual layer. The MCP server gives you that same data as a queryable API your AI can call directly.
What the MCP server actually does
@betterdb/mcp is a thin proxy. It exposes BetterDB's monitoring data as a set of typed tools that any MCP-compatible client - Claude Code, Cursor, Windsurf - can call. No business logic lives in it. Every tool is a direct call to the BetterDB API. The AI never connects to your Valkey instance - it queries BetterDB's platform, which has been collecting, persisting, and analyzing operational data from your instance continuously.
This matters for a reason beyond architecture: the AI can observe your database, but it cannot touch it. No writes, no deletes, no configuration changes. Hallucinated data stays in the conversation - it can't make it into your keyspace. For teams cautious about giving AI tooling any foothold near production infrastructure, that's the right boundary.
The full tool surface:
Observability
get_health- synthetic health summary (hit rate, fragmentation, replication lag). The right starting point for any investigation.get_info- full INFO stats, optionally filtered by section (memory, clients, replication, keyspace, stats).get_slowlog/get_slowlog_patterns- raw entries and pattern-aggregated summaries from persisted storage. Survives the 128-entry buffer rotation.get_commandlog/get_commandlog_history/get_commandlog_patterns- COMMANDLOG data (Valkey 8.1+). Wider net than slowlog - captures every command above a configurable threshold, not just the slowest ones.get_anomalies- Z-score anomaly events for memory, CPU, hit rate, ops/sec, and more. Correlated and queryable, no threshold configuration required.get_memory- MEMORY DOCTOR assessment and MEMORY STATS breakdown.get_latency/get_latency_history- latency event history and per-event trend over time.get_hot_keys- LFU frequency scores or idle time analysis, depending on your eviction policy.get_clients/get_client_activity- active client list plus time-bucketed historical activity.get_acl_audit- ACL audit log for auth failure investigation.
Cluster
get_cluster_nodes/get_cluster_node_stats/get_cluster_slowlog- cluster-wide visibility, aggregated across nodes.get_slot_stats- per-slot key counts and CPU usage (Valkey 8+, via CLUSTER SLOT-STATS).
Connection management
list_instances/select_instance- list registered instances and set the active one.add_connection/test_connection/remove_connection/set_default_connection- manage connections directly from your AI client without opening the UI.
Monitor lifecycle
start_monitor/stop_monitor- start and stop the BetterDB monitor as a persistent background process from within the MCP session.
These are Valkey-native primitives. COMMANDLOG is a Valkey 8.1 primitive that doesn't exist in Redis. CLUSTER SLOT-STATS is Valkey 8.0. BetterDB works with Redis too - but these primitives are Valkey-only, and no Redis-compatible monitoring tool surfaces them because they simply don't have access to them on Redis instances.
Why natural language changes the investigation
When you investigate through a dashboard, your workflow is: open a panel, look at data, form a hypothesis, open another panel, look at different data, try to correlate them. The tool shapes what you ask.
When you investigate through an MCP-connected AI, your workflow is: ask a question, get an answer, ask a follow-up. The question shapes what data gets retrieved.
That's a meaningful shift. Here's what it looks like in practice.
Correlating across data sources unprompted. In the MemoryDB incident, Claude called get_anomalies after reviewing the slowlog - and without being asked, cross-referenced the client IP from the slowlog against the anomaly timeline:
Correlating with the slowlog data: these spikes align with the FCALL burst
from 172.31.13.105:41678 - the same client hammering session_cleanup,
product_cache_warm, and order_aggregate. That single client is responsible
for ops going from 68/s to 11K/s. This looks like a scheduled batch job
that fires every ~5 minutes.
A dashboard shows you the anomaly and the slowlog in separate panels. Connecting them is a manual step. The AI does it as part of answering the question.
Asking about causes, not metrics. You can ask "what was eating all the memory?" instead of "show me MEMORY STATS." Claude translates intent into the right tool call sequence, interprets the numbers, and surfaces what's actionable. The difference between current: 75MB and peak: 1.41GB, data since evicted, jemalloc hasn't released RSS yet - fragmentation will recover under normal load is not a data difference. It's an interpretation difference.
Following the thread. Each answer becomes the context for the next question. You don't reset between questions the way you do when switching dashboard tabs. The investigation accumulates.
Setup
Cloud:
{
  "mcpServers": {
    "betterdb": {
      "type": "stdio",
      "command": "npx",
      "args": ["@betterdb/mcp"],
      "env": {
        "BETTERDB_URL": "https://<your-workspace>.app.betterdb.com",
        "BETTERDB_TOKEN": "<your-token>"
      }
    }
  }
}
Generate a token from Settings → MCP Tokens in BetterDB Cloud.
Self-hosted:
No token, no config file. The MCP server can start and manage the monitor process itself - so there's almost no setup:
claude mcp add betterdb -- npx @betterdb/mcp betterdb-mcp --autostart --persist
--autostart starts the monitor if it isn't running. --persist keeps it alive across MCP sessions. From that point, your AI has access to the full tool surface without any manual process management.
If you're running multiple instances, set BETTERDB_INSTANCE_ID to skip the select_instance step on every session.
The agent use case
The debugging workflow above is human-driven - you're in Claude Code asking questions after an incident. But the same MCP tools are available to any agent that runs in an MCP-compatible environment.
That opens a different category of use.
An agent building a feature that writes to Valkey can call get_health before and after a deploy, catch a fragmentation regression without being told to look for one, and surface it in the PR. A code review agent can flag a pattern that matches known hot key anti-patterns by cross-referencing get_hot_keys against the diff. A scaffolding agent generating Valkey integration code can pull actual key patterns from get_slowlog_patterns and write queries that match how the instance is actually used, not how it's supposed to be used.
This is what "MCP as infrastructure" means for databases. The observability layer isn't just for humans running investigations. It's a source of ground truth that agents can read directly, without the data being passed through a human first.
Valkey generates a lot of operational signal - per-command latency, per-client behavior, memory breakdown by allocator, slot-level CPU in cluster mode. Most of that signal has historically been readable only by an operator who knows where to look. BetterDB collects and persists it. MCP makes the collected data queryable by anything that can call a tool - without the AI ever touching your database directly.
What persisted data makes possible
This is worth stating clearly because it's the thing most monitoring tools don't do.
Valkey's native primitives are real-time. SLOWLOG GET returns the current buffer. COMMANDLOG is a ring buffer. CLIENT LIST is instantaneous. When you query them, you get now. When you query them two hours later, you get now again - the previous state is gone.
BetterDB polls these primitives continuously and writes to a time-series store. The MCP tools query that store, not the live instance. When you ask "show me what was slow during the incident," you're querying persisted records, not a live buffer that's been rotated six times since the incident ended.
That's why get_slowlog_patterns returns data for incidents that happened yesterday. And why get_anomalies can reconstruct a burst pattern from eight correlated events across a two-hour window. The data exists because something was collecting it the whole time - not because you were watching the dashboard when it happened.
If you were investigating through CloudWatch or a stateless Valkey client, the slowlog is already gone by the time you're asking the question. The query still runs. It just returns nothing useful.
The short version
The BetterDB MCP server is a direct line from your AI to the operational history BetterDB has collected from your Valkey instance. Slowlogs that survived buffer rotation. Anomalies detected automatically without pre-configured thresholds. Valkey-native primitives - COMMANDLOG, CLUSTER SLOT-STATS - that Redis tooling doesn't expose.
For incident debugging, it means asking four questions in plain English instead of spending 20 minutes aligning CloudWatch tabs. For agent use, it means the observability layer is finally readable by the systems that generate the load - not just the humans who manage it.