Debugging a MemoryDB Incident: CloudWatch vs BetterDB
A walkthrough of the same MemoryDB incident debugged three ways - CloudWatch, BetterDB UI, and BetterDB MCP. Same data, very different outcomes.
MemoryFragmentationRatio: 6.11 . DatabaseMemoryUsagePercentage: 99.9% . DB0AverageTTL: 2,158 hours
It's the morning after an incident. Memory hit capacity, the engine spilled to disk, and whatever caused it has been running long enough that most keys have no expiry - they're not leaving on their own.
The slowlog on the instance has already been overwritten. Here's how you investigate it - three ways.
The Incident
A MemoryDB cluster running Valkey 7.3.0 degraded at some point during the previous day.
Path 1: CloudWatch
Step 1: Open the MemoryDB metrics dashboard
You navigate to CloudWatch and pull up the cluster metrics. You immediately see the memory charts and start correlating.
What you find:
DatabaseMemoryUsagePercentage: peaked at 99.9%BytesUsedForMemoryDB: climbed from 24MB to 1.47GBFreeableMemory: dropped to 123MBSwapUsage: 295MB - the engine spilled to diskDB0AverageTTL: 2,158 hours - the average TTL across all keys is roughly 90 days. A significant portion of what was written to memory has no meaningful expiry and won't leave on its own.MemoryFragmentationRatio: 6.11 - at this level the allocator overhead is using more memory than the actual dataActiveDefragHits: 152K - Valkey was scrambling to reclaim memory under load
What you don't know: What wrote all that data? Which keys? Which namespace?
Step 2: Look at the command metrics
CloudWatch breaks commands into categories: StringBasedCmds, KeyBasedCmds, EvalBasedCmds, etc.
What you find:
StringBasedCmds: 3.14M - massive write volumeSetTypeCmds: 390.83KKeyBasedCmds: 4.87M - something scanned the keyspaceEvalBasedCmds: 19.45K - server-side functions ran. CloudWatch groups bothEVALandFCALLunder this metric, so you cannot distinguish between ad-hoc scripts and named functions
What you don't know: Which specific commands? Which keys did they touch? KeyBasedCmds could be KEYS *, SCAN, RANDOMKEY, EXISTS - CloudWatch doesn't distinguish. EvalBasedCmds tells you server-side functions ran, not which ones, what they did, or how long they took.
Step 3: Check the connection spike
What you find:
NewConnections: spiked to 300 in one minuteCurrConnections: moved from 6 to 15.8 at peak
What you don't know: Which clients connected? Which IPs? Why did they disconnect immediately? The churn is invisible in CurrConnections because the connect/disconnect cycle completed within the 1-minute metric resolution window.
Step 4: Look for slow query data
There is no step 4. CloudWatch has no slowlog integration. The slowlog lived on the Valkey instance, had a default capacity of 128 entries, and was overwritten during the incident. If you're reading this two hours later, it's gone.
Step 5: Try to establish a timeline
You now have six browser tabs open, each with a different CloudWatch graph. You're manually aligning timestamps across BytesUsedForMemoryDB, EngineCPUUtilization, NewConnections, StringBasedCmds, ReplicationLag, and SwapUsage, trying to reconstruct the order of events.
Conclusion after 20–30 minutes: Memory filled up, something wrote a lot of string keys, 19K server-side function calls ran from a single client, connections spiked briefly, and the replica fell behind. You have no idea which client caused it, which keys are still in memory, or whether the root cause is fixed.
Path 2: BetterDB
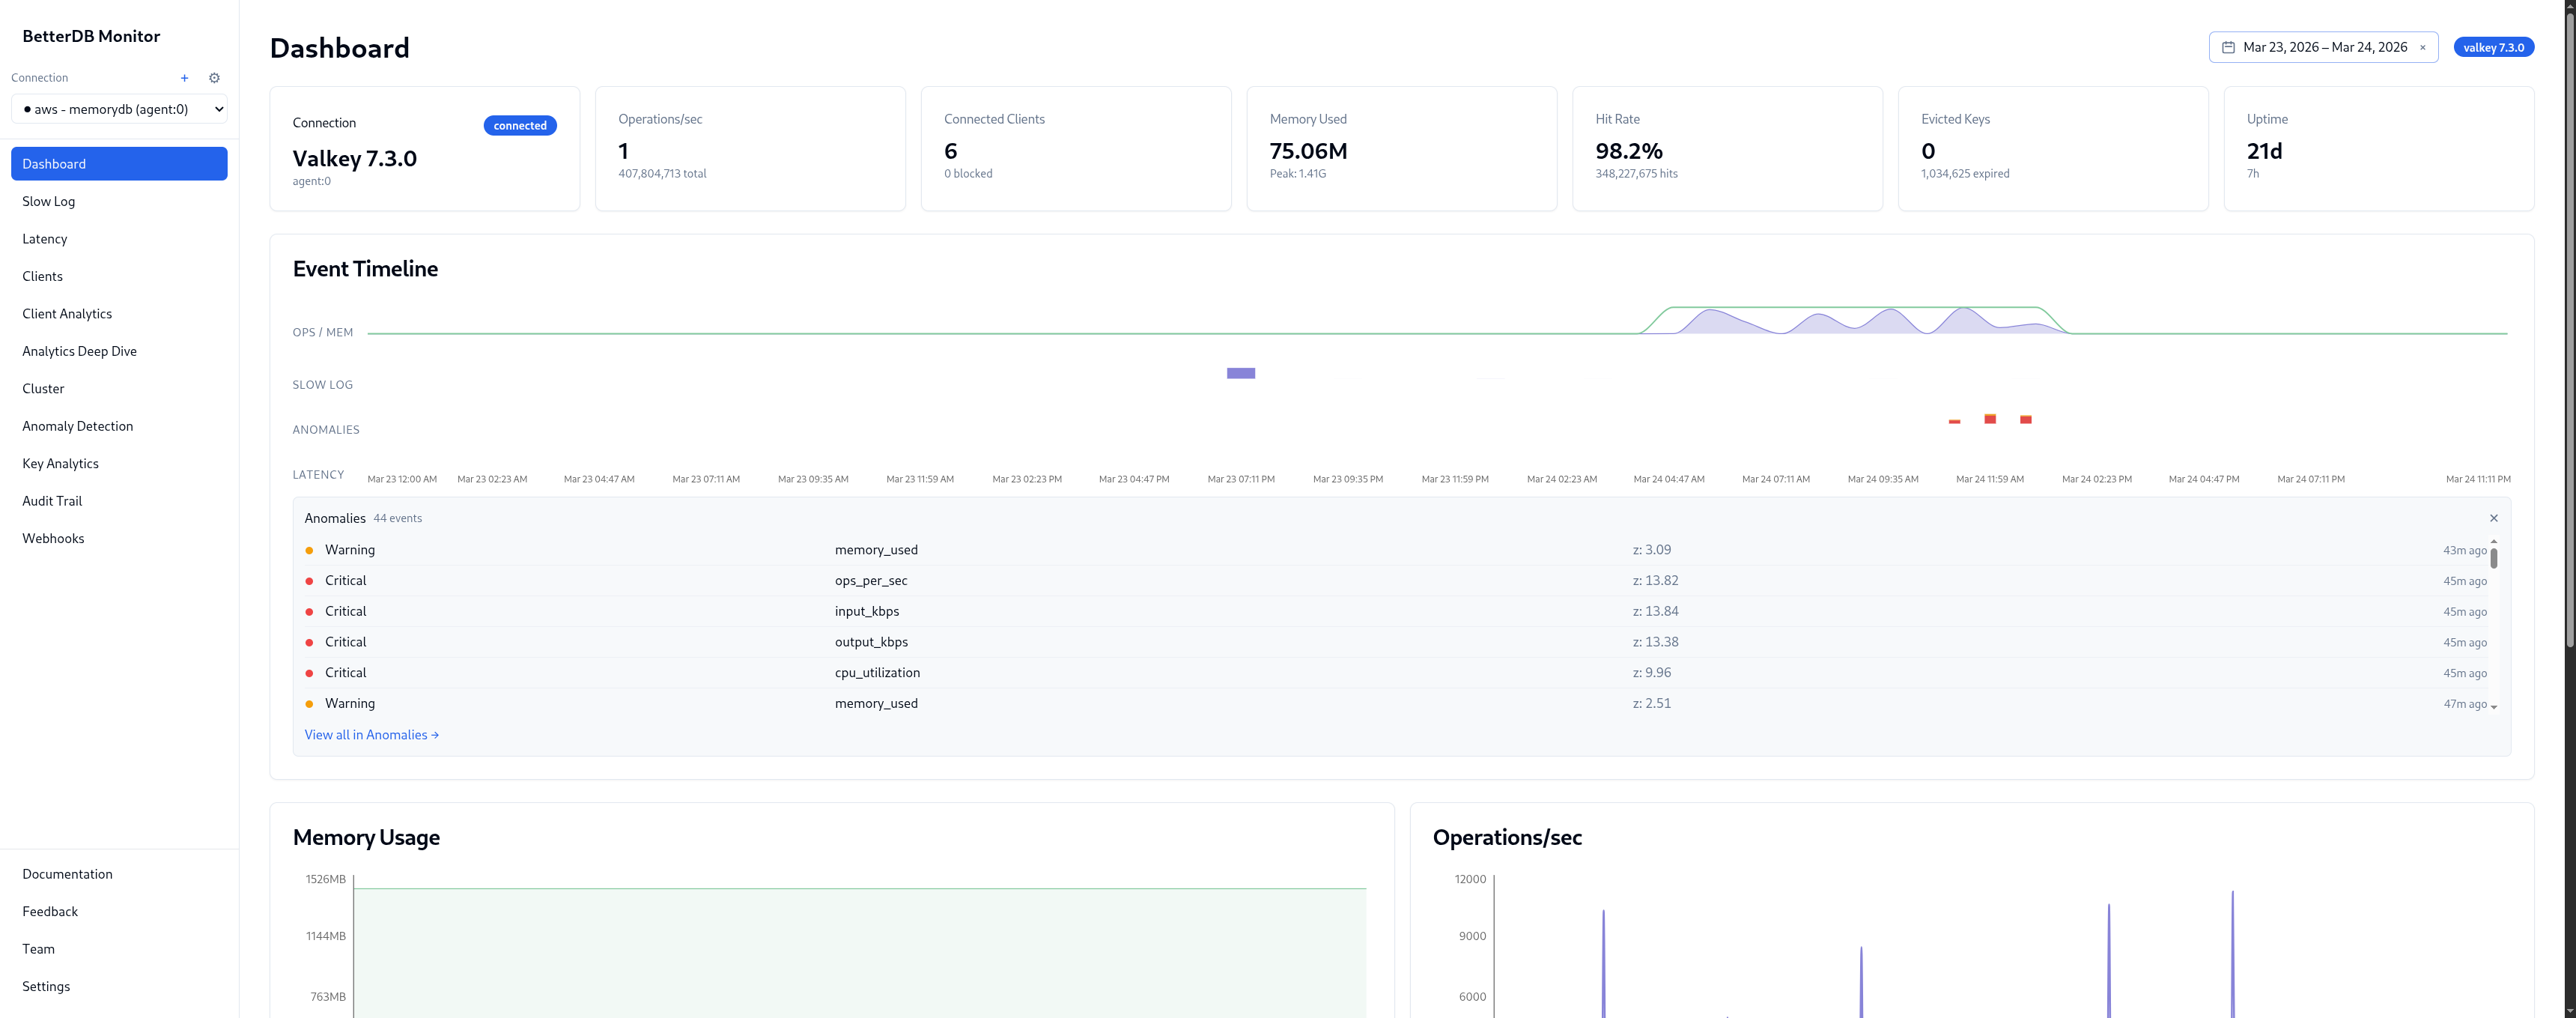
Step 1: Open the dashboard
The Event Timeline shows OPS/HIGH, SLOW LOG, and ANOMALIES on a unified time axis. The ops burst, the slowlog marker, and the anomaly flags all land at the same timestamp - no tab-switching to correlate them.
Memory peaked at 1.53GB. CPU spiked to 75% system at the same moment. The sequence is visible at a glance: the write flood came first, then CPU saturated, then slowlog entries started accumulating.
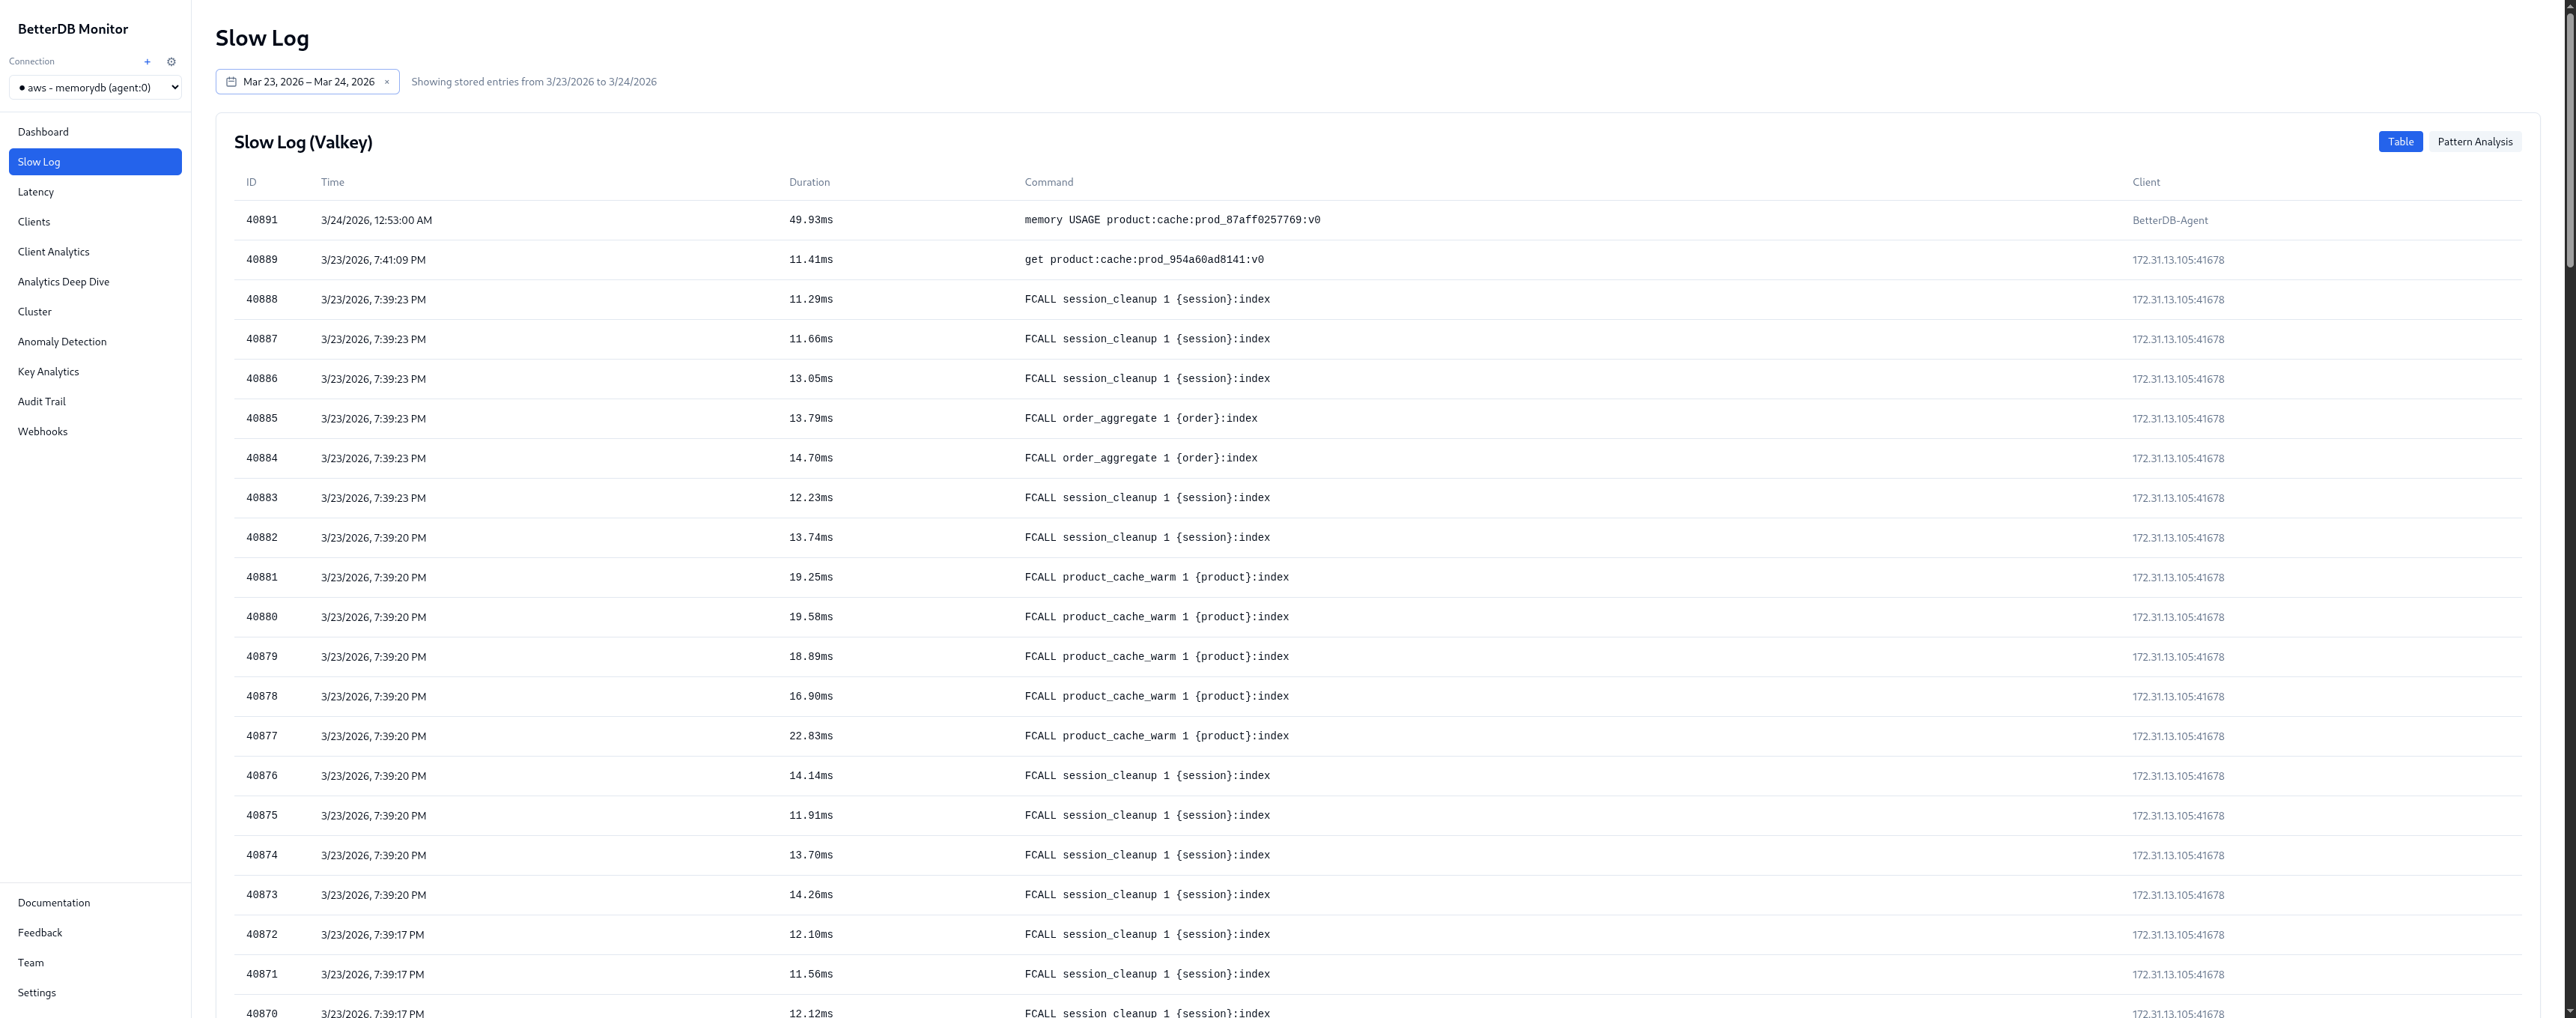
Step 2: Open Slow Log
BetterDB persists the slowlog continuously via the agent. The incident window has 128 slow queries captured across 4 unique patterns and 2 command types.
Pattern breakdown:
| Pattern | % | Avg | Max |
|---|---|---|---|
FCALL session_cleanup | 57.0% | 12.6ms | 14.7ms |
FCALL product_cache_warm | 30.5% | 17.7ms | 22.8ms |
FCALL order_aggregate | 11.7% | 14.2ms | 15.1ms |
GET product:cache:* | 0.8% | 11.4ms | 11.4ms |
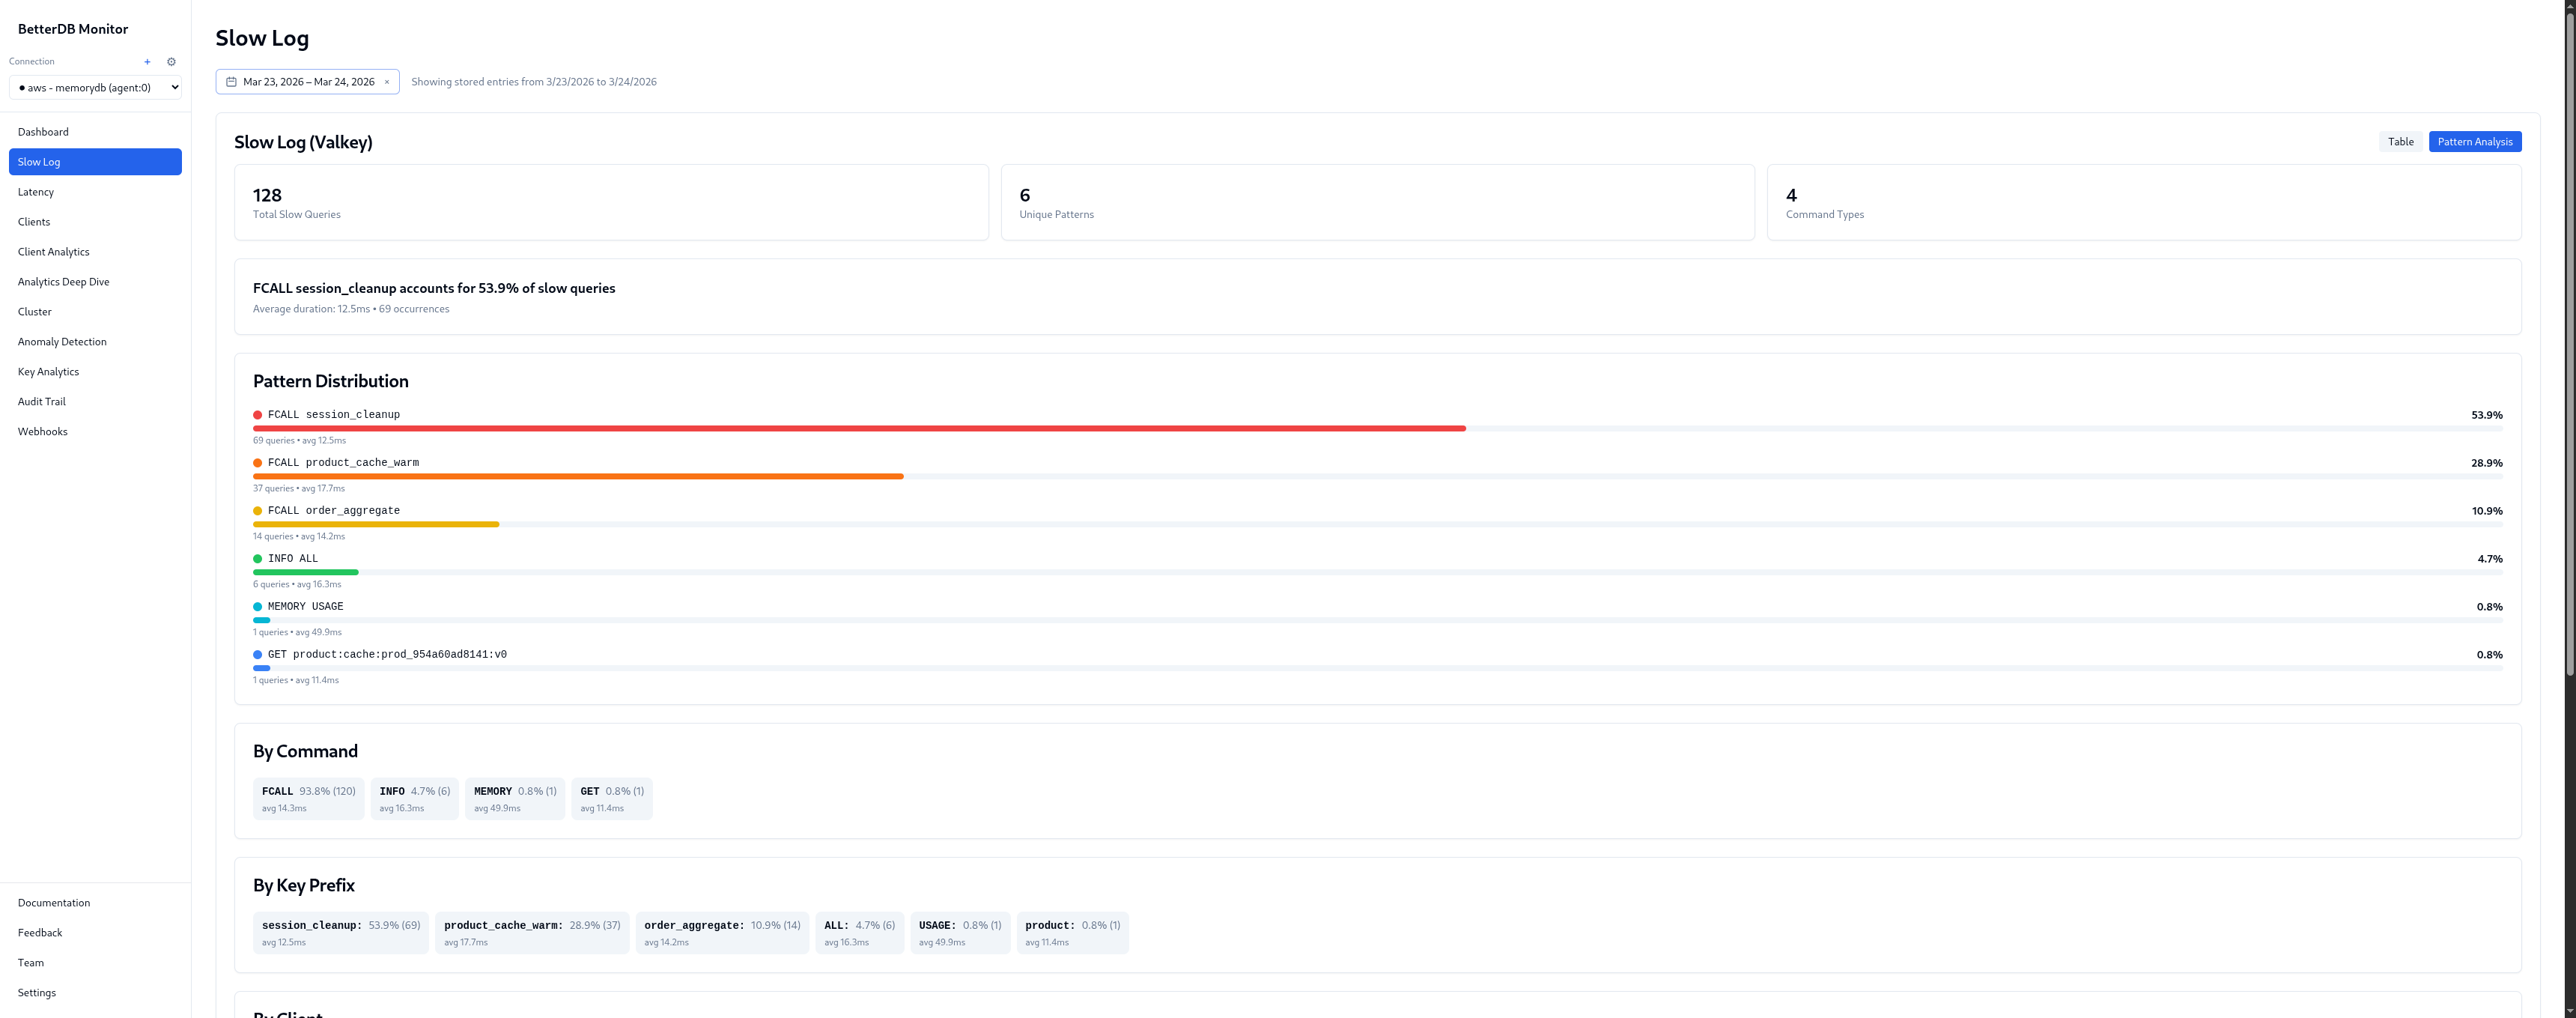
Three named server-side functions are responsible for 99% of slow queries. product_cache_warm is the worst offender at 17.7ms average, peaking at 22.8ms. Given the name and latency pattern, it's likely warming a product index on every call - re-fetching or recomputing entries that could be cached for longer.
By client: 172.31.13.105:41678 - 100% of the 128 slow queries, avg 14.3ms. Every slow command in this incident came from a single IP. In a production environment that maps directly to a specific service, pod, or cron job.
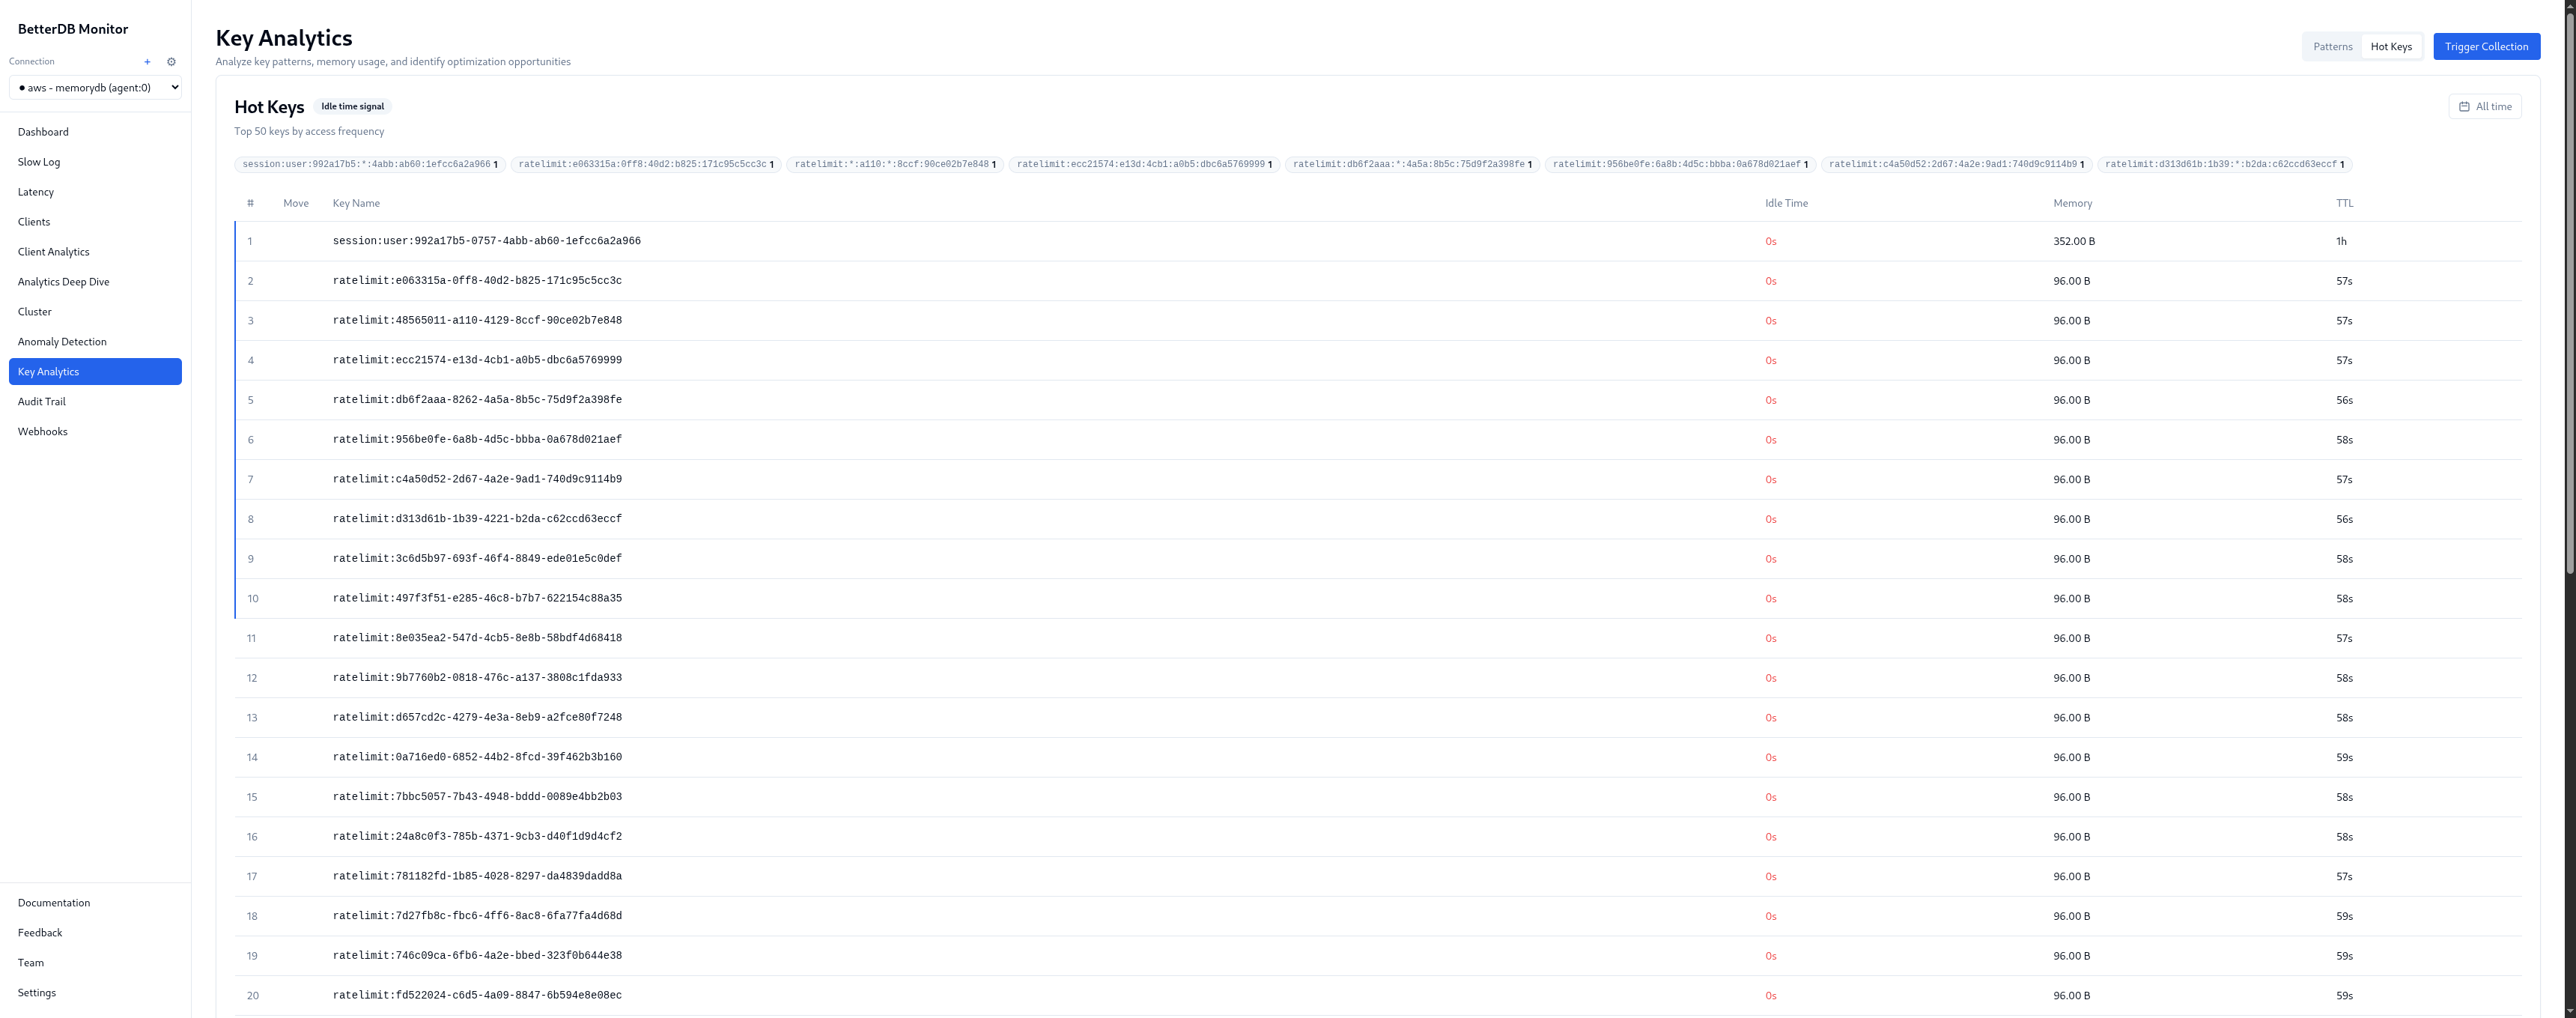
Step 3: Open Key Analytics
Top-level:
- 519K total keys, 665MB
- 193K stale keys (idle > 24h) - keys that haven't been touched since before the incident
- 500K expiring soon (TTL < 1hr) - the ratelimit and session keys cycling out
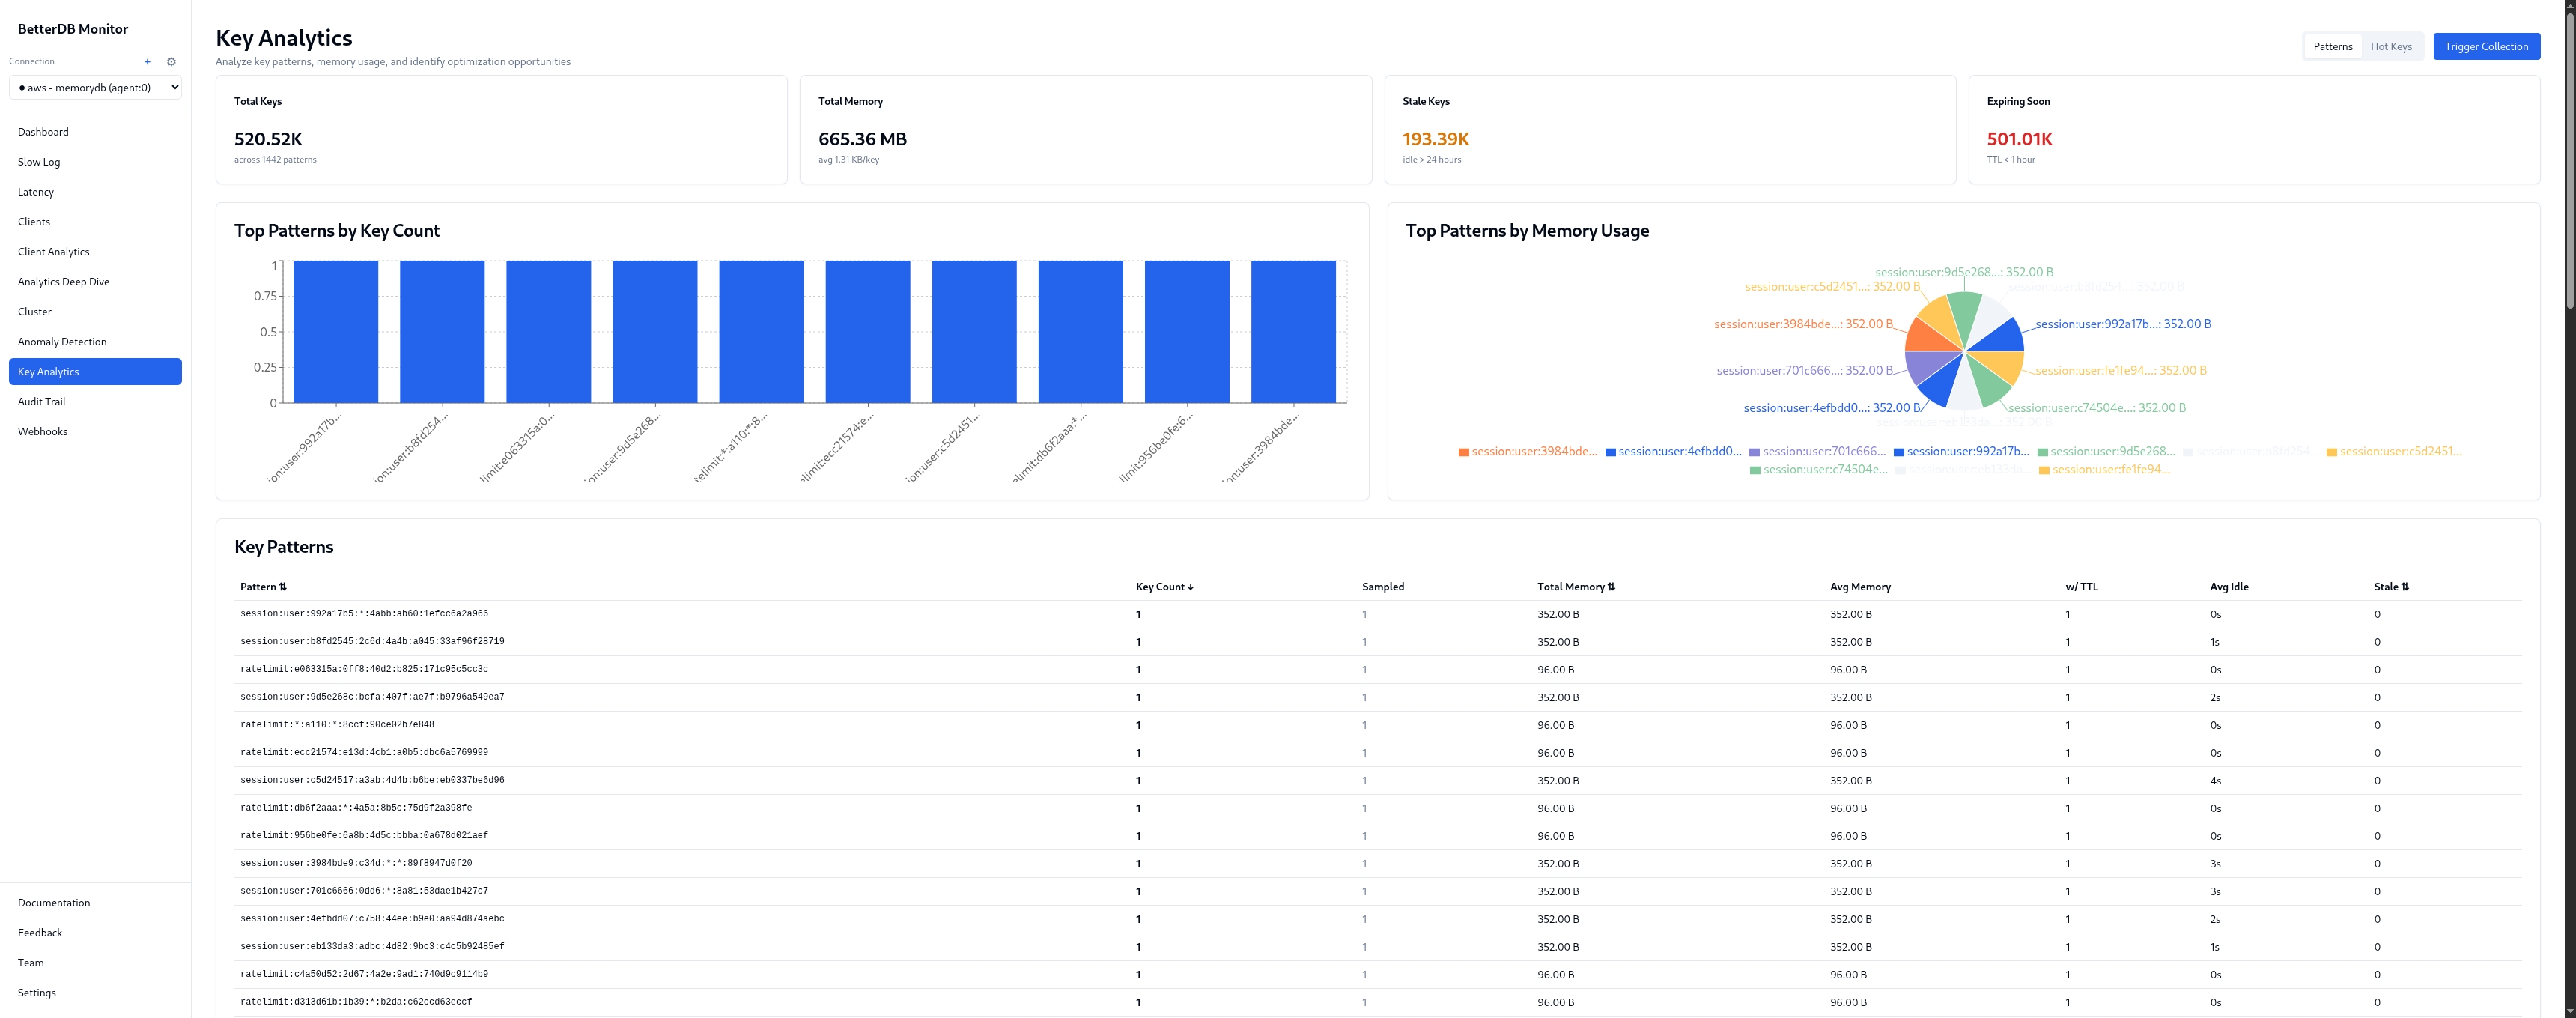
Key patterns visible:
session:user:*- 352B per key, TTL ~1hr. Legitimate session data, healthy churn.ratelimit:*- 104B per key, TTL ~1–2 min. High-frequency, tiny footprint. Hot keys by access frequency.product:cache:*- larger values, no TTL on a significant portion. This is the memory pressure culprit - product cache keys written during the incident without expiry.order:recent:*- with TTL, legitimate.
Step 4: Open Anomaly Detection
100 anomalies detected, 85 critical, 11 warning across 50 unique events. The breakdown by type tells the full incident story:
- Traffic Burst - ops/sec, input_kbps, output_kbps, cpu_utilization all spiking in correlation. Z-scores of 13–14. This is the write flood phase.
- Cache Thrashing - cache miss rate elevated during the hot key contention phase. Keys being invalidated and re-fetched faster than they can be served from memory.
- Slow Queries - flagged independently from the slowlog, correlated with the traffic burst timestamp.
- Connection Load - connection count anomaly matching the client churn phase.
- Memory Pressure - flagged as the product cache write flood pushed usage toward the limit.
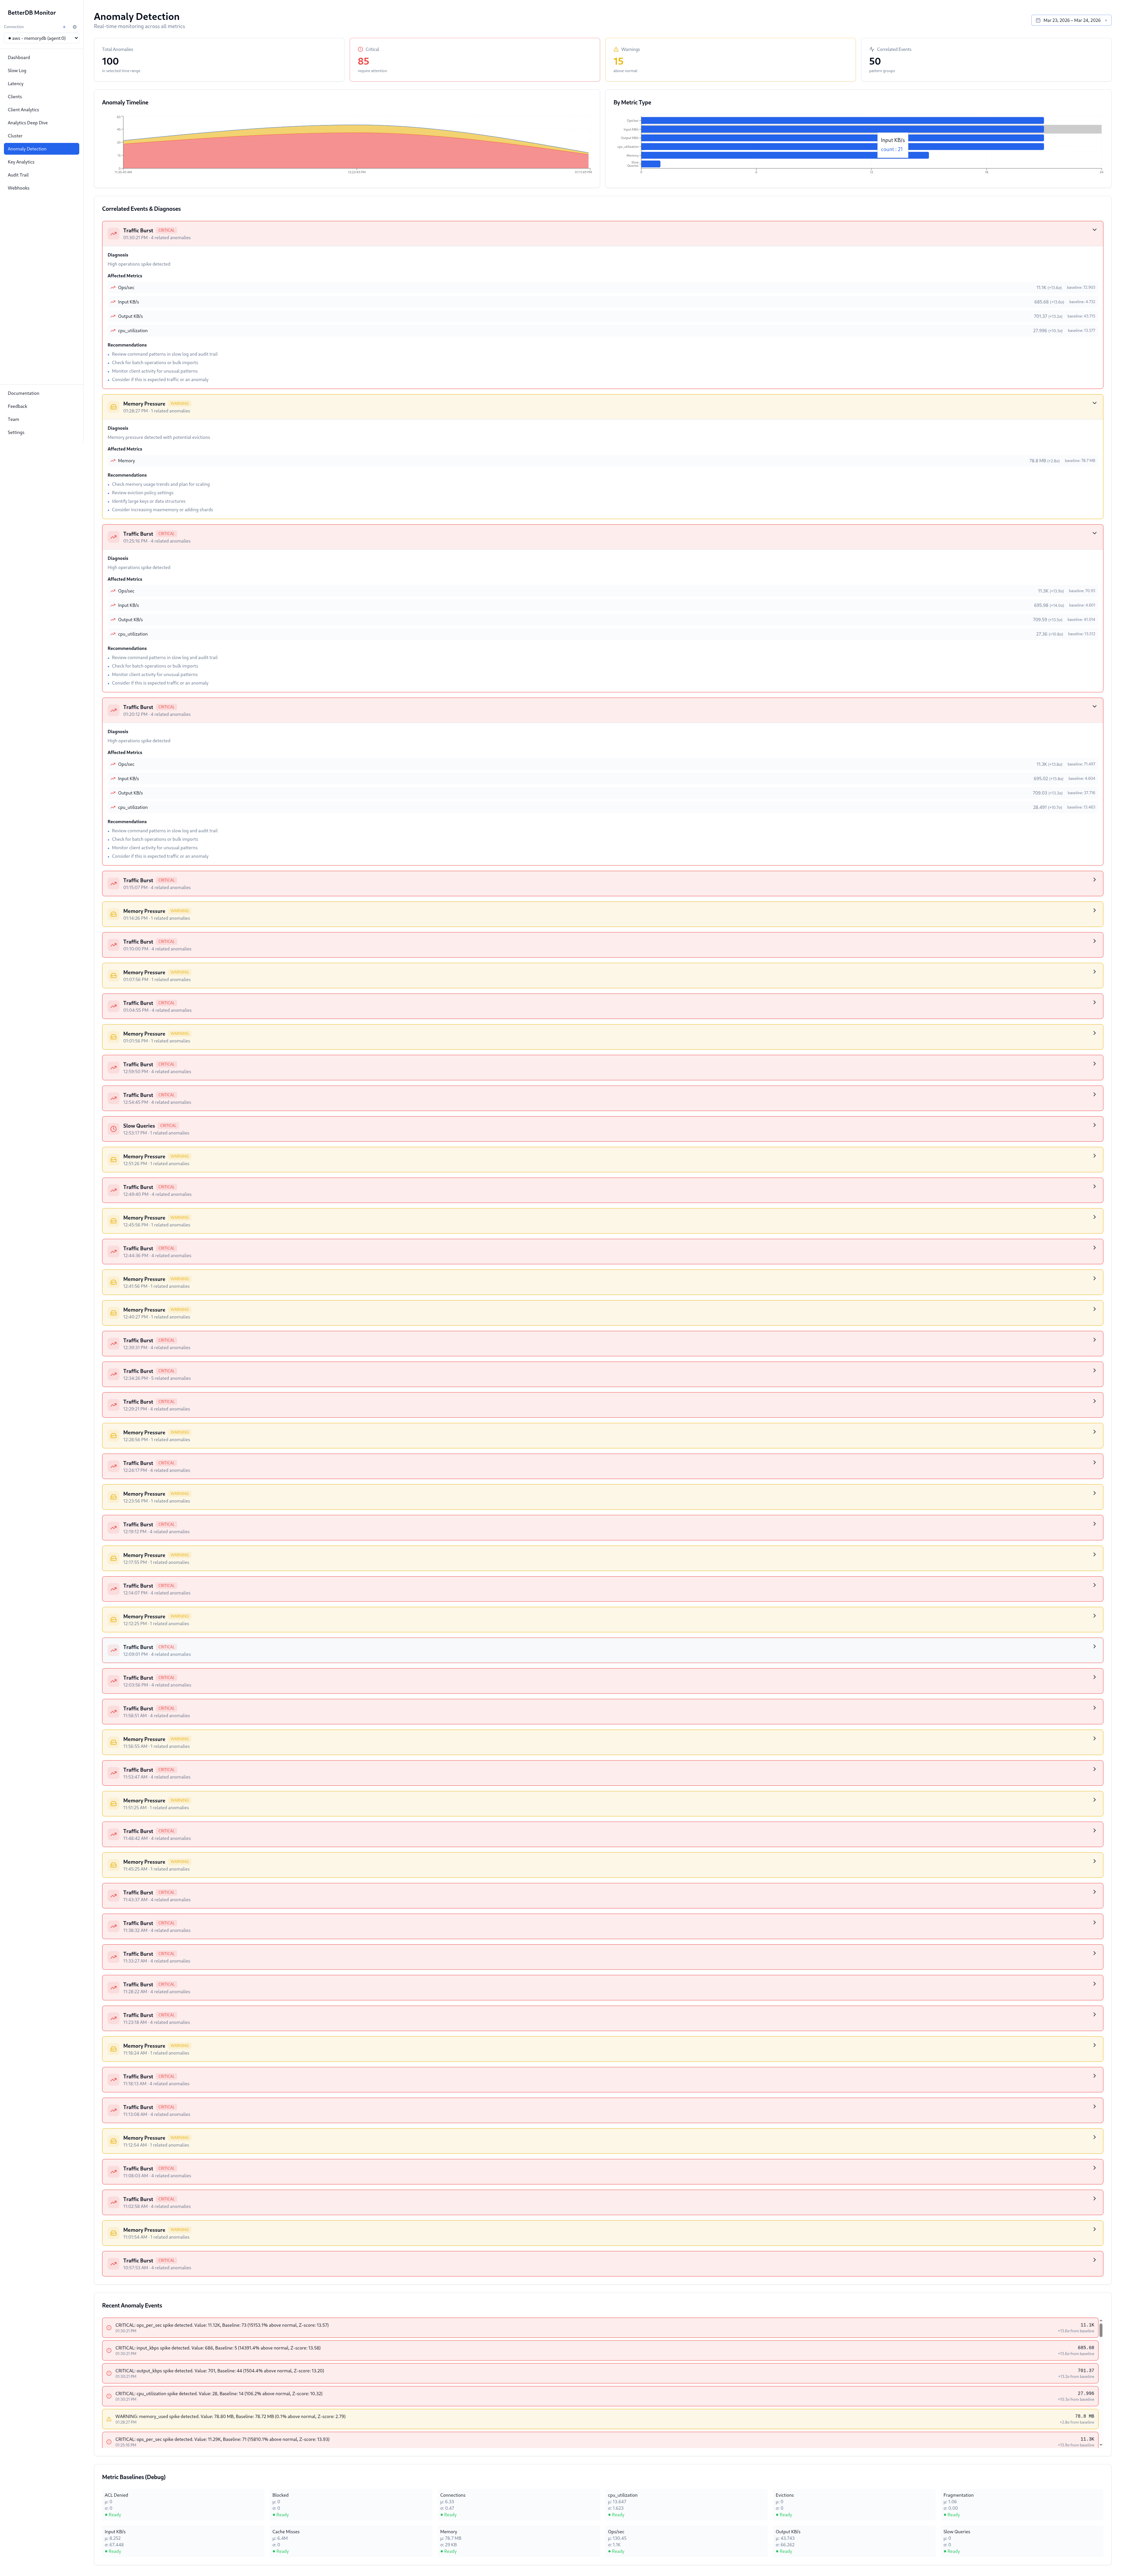
No pre-configured thresholds. BetterDB detected all five anomaly types automatically from baseline deviation.
Step 5: Resolution
With the above, remediation is concrete:
- Audit
172.31.13.105- every slow command came from this client. Find the service, identify which job is callingsession_cleanup,product_cache_warm, andorder_aggregatein rapid bursts, and rate-limit or reschedule it. - Add TTLs to
product:cache:*- a significant portion have no expiry. That's what filled memory. Set a TTL appropriate to your cache invalidation strategy. - Fix the connection-per-request pattern - the ratelimit key churn and connection anomaly point to a service creating a new connection per request. Switch to a connection pool.
- Review I/O threading - BetterDB's I/O Thread Activity panel shows the instance is handling I/O on a single thread. On self-hosted Valkey, setting
io-threads 4would reduce main-thread saturation under this connection volume. On MemoryDB, thread configuration is managed by AWS and is not directly configurable - but the panel still pinpoints where the bottleneck is.
Path 3: BetterDB MCP
There's a third option that doesn't require opening a browser at all. The BetterDB MCP server connects Claude Code directly to your monitoring data - so you can investigate an incident in plain English, in the same terminal you're already working in.
This walkthrough uses BetterDB Cloud, where the MCP server connects to your hosted workspace. Configure it once in your MCP client:
{
  "mcpServers": {
    "betterdb": {
      "type": "stdio",
      "command": "npx",
      "args": ["@betterdb/mcp"],
      "env": {
        "BETTERDB_URL": "https://<your-workspace>.app.betterdb.com",
        "BETTERDB_TOKEN": "<your-token>"
      }
    }
  }
}
If you're self-hosting, setup is a single command - no config file, no tokens:
claude mcp add betterdb -- npx @betterdb/mcp betterdb-mcp --autostart --persist
Then ask questions.
Step 1: Orient
"What's the health of my MemoryDB instance?"
Claude calls list_instances, selects the MemoryDB connection, then get_health. One tool call, no parsing:
● betterdb - get_health (MCP)

  Hit rate:              98.2%  - excellent cache performance (current state, post-incident)
  Memory fragmentation:  1.93   - down from 6.11 during the incident (write flood data has since been evicted), but jemalloc hasn't returned the memory to the OS yet - hence the elevated RSS
  Connected clients:     6
  Role:                  master
  Replication lag:       none
Step 2: Find the slow commands
"Show me what was slow in the last 24 hours"
Claude calls get_slowlog and get_slowlog_patterns. Because BetterDB persists the slowlog continuously, this data survives the instance's 128-entry in-memory buffer - you can query it hours after the fact:
● Here's the slowlog summary for the last 24 hours - 128 slow commands total:

  ┌──────────────────────────┬───────┬──────────────┬──────────────┐
  │ Pattern                  │ Count │ Avg Duration │ Max Duration │
  ├──────────────────────────┼───────┼──────────────┼──────────────┤
  │ FCALL session_cleanup    │  71   │    12.5ms    │    14.7ms    │
  │ FCALL product_cache_warm │  37   │    17.7ms    │    22.8ms    │
  │ FCALL order_aggregate    │  14   │    14.2ms    │    15.1ms    │
  │ GET product:cache:*      │   1   │    11.4ms    │    11.4ms    │
  └──────────────────────────┴───────┴──────────────┴──────────────┘

  product_cache_warm is the slowest pattern averaging 17.7ms with peaks at 22.8ms.
  All FCALL traffic comes from a single client (172.31.13.105:41678).
Step 3: Understand the memory spike
"What was eating all the memory?"
Claude calls get_memory and get_info filtered to the memory section:
● Here's the memory story:

  ┌───────────────────────┬───────────┐
  │ Current usage         │  75 MB    │
  │ Peak usage            │  1.41 GB  │  ← the incident
  │ Current as % of peak  │  5.2%     │
  │ RSS (actual resident) │  145 MB   │
  │ Fragmentation ratio   │  1.93     │
  │ Lua VM + scripts      │  4 MB     │  ← 3 functions, 20 cached scripts
  └───────────────────────┴───────────┘

  Something previously consumed 1.41 GB, but current logical usage is only 75 MB.
  The data was deleted or expired, but jemalloc didn't release the memory back to
  the OS - so RSS is still 145 MB (nearly 2x actual usage). That's the 1.93
  fragmentation ratio.

  On self-hosted Valkey, running MEMORY PURGE would bring RSS back in line without affecting data. On MemoryDB, this command is not available - RSS will recover gradually as jemalloc reuses the freed pages under normal load.
  maxmemory-policy is noeviction - nothing will be auto-evicted if usage climbs again.
The Lua VM entry is worth calling out: 4 MB for 3 registered functions and 20 cached scripts. That's session_cleanup, product_cache_warm, and order_aggregate still loaded - the same functions dominating the slowlog. The 20 cached script entries are from EVAL calls elsewhere in the application, separate from the named functions but sharing the same Lua VM memory budget.
Step 4: Confirm with anomaly detection
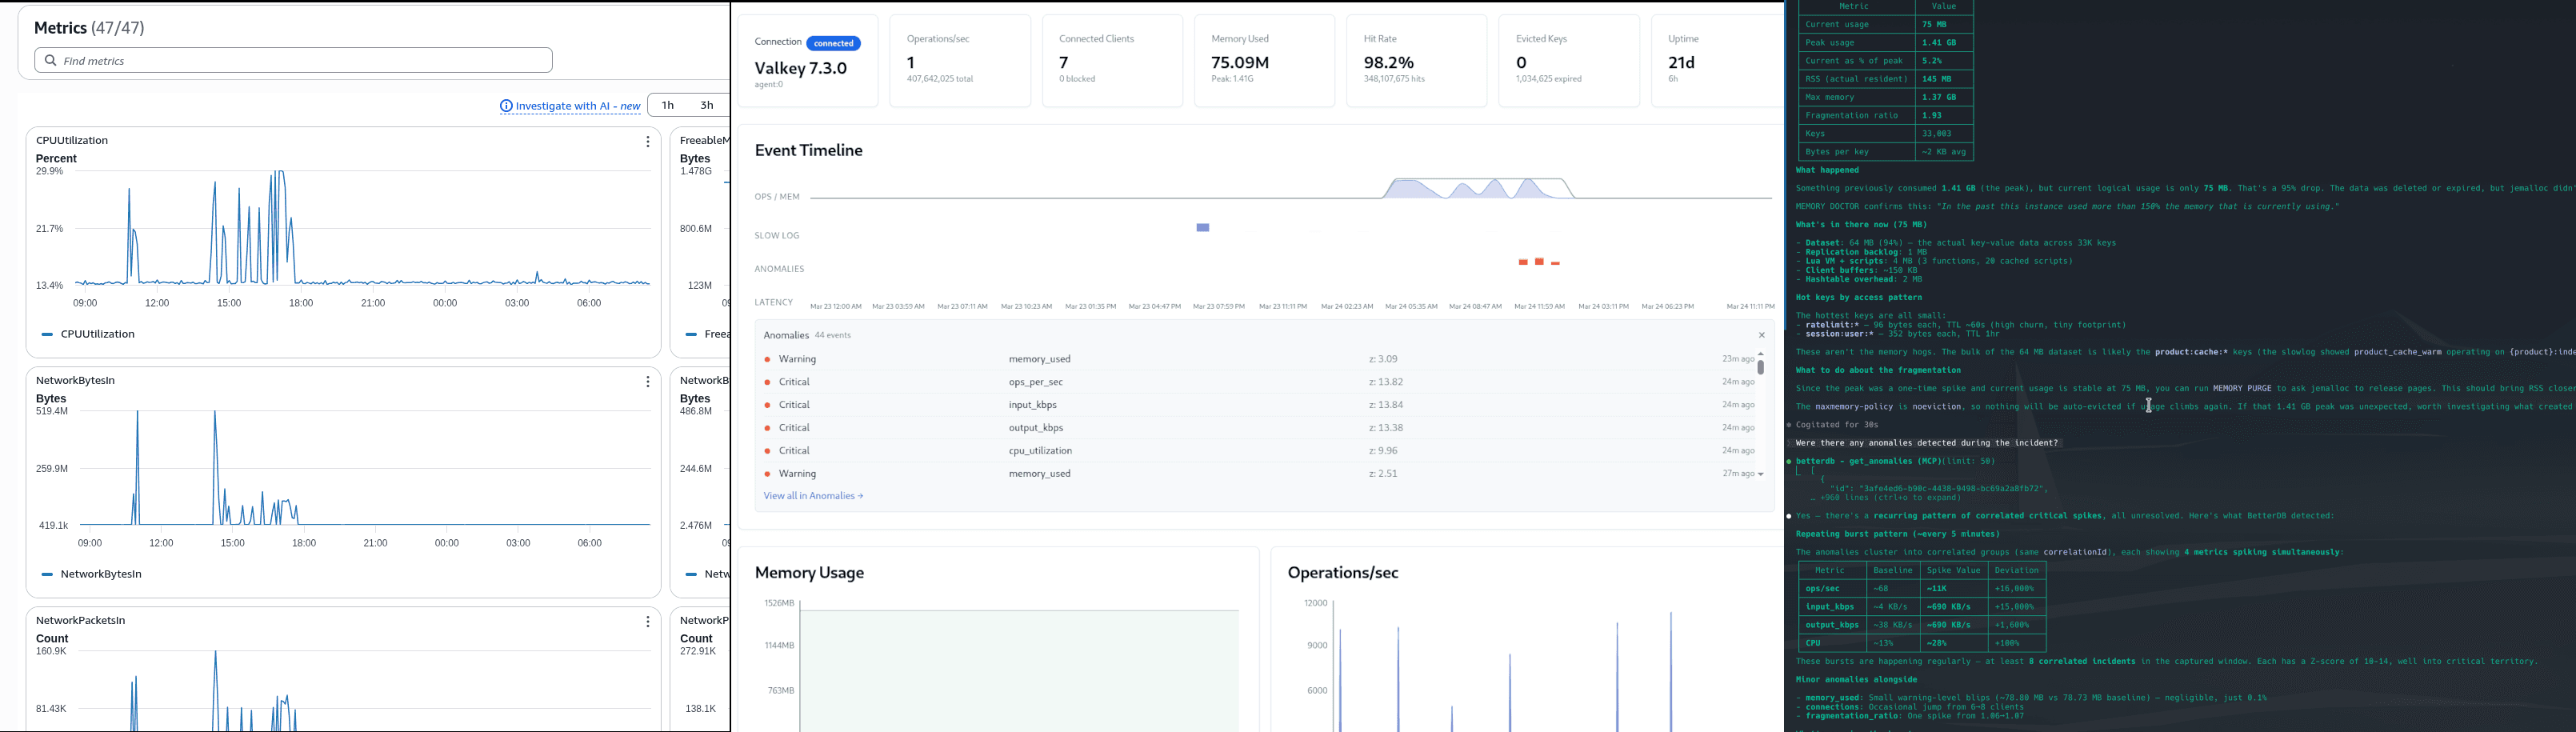
"Were there any anomalies detected during the incident?"
Claude calls get_anomalies and correlates with the slowlog data unprompted:
● Yes - there's a recurring pattern of correlated critical spikes, all unresolved.

  Repeating burst pattern (~every 5 minutes):

  ┌─────────────┬──────────┬─────────────┬───────────┐
  │ Metric      │ Baseline │ Spike Value │ Deviation │
  ├─────────────┼──────────┼─────────────┼───────────┤
  │ ops/sec     │   ~68    │   ~11,000   │ +16,000%  │
  │ input_kbps  │  ~4 KB/s │  ~690 KB/s  │ +15,000%  │
  │ output_kbps │ ~38 KB/s │  ~690 KB/s  │  +1,600%  │
  │ cpu         │   ~13%   │    ~28%     │   +100%   │
  └─────────────┴──────────┴─────────────┴───────────┘

  8 correlated incidents in the captured window. Z-scores of 10–14.

  Correlating with the slowlog data: these spikes align with the FCALL burst
  from 172.31.13.105:41678 - the same client hammering session_cleanup,
  product_cache_warm, and order_aggregate. That single client is responsible
  for ops going from 68/s to 11K/s. This looks like a scheduled batch job
  that fires every ~5 minutes. The 1.41 GB peak was likely from a previous
  run that loaded a much larger dataset without TTLs.
What the MCP path adds
You didn't open a browser. You didn't switch tabs. Four questions in plain English in your terminal produced a complete incident timeline - from "something is slow" to "a batch job at this IP fires every 5 minutes, here's what it does, here's what it did to memory, and here's why fragmentation is still elevated."
The data powering those answers is the same persisted slowlog, anomaly history, and memory diagnostics available in the BetterDB UI. The MCP server is a different surface for the same forensics - one that fits into the workflow where the incident investigation actually happens.
Side by side
| CloudWatch | BetterDB UI | BetterDB MCP | |
|---|---|---|---|
| Memory spike visible | Yes | Yes | Yes - with peak vs current breakdown |
| Which keys caused it | No | Yes - by prefix, count, memory | Yes - via get_memory + hotkey data |
| Keys with no TTL | No | Yes | Partially - via memory stats |
| Slow queries | No (overwritten) | Yes - 128 captured, persisted | Yes - get_slowlog_patterns |
| Slowest command identified | No | Yes - FCALL names, avg latency | Yes - with full pattern table |
| Client responsible | No | Yes - IP + avg latency | Yes - IP flagged in both slowlog and anomaly correlation |
| Anomaly detection | Manual threshold setup required | Automatic, Z-score based, UI | Automatic, queryable in plain English |
| Root cause correlation | No | Partial - visual, manual | Yes - Claude correlated client IP across slowlog + anomalies unprompted |
| Correlated timeline | 6 tabs, manual alignment | Single view | Natural language summary |
| Data availability hours later | Yes (metrics only) | Yes (metrics + slowlog + key state) | Yes (same data, terminal interface) |
| Requires browser | Yes | Yes | No |
The core difference
CloudWatch is an infrastructure metrics layer. It tells you the shape of an incident - that memory went up, that CPU spiked, that connections burst. That's genuinely useful for knowing that something happened and when.
It doesn't tell you what to fix.
BetterDB persists the ephemeral operational data that Valkey generates during an incident - slowlog entries, command patterns, client identities, key-level memory breakdown - and keeps it queryable after the fact. The UI gives you the full picture in one place. The MCP server puts the same data one question away, in whatever tool you're already working in.
The gap isn't about better graphs. It's about whether the forensic data exists at all when you need it - and whether you have to hunt through six browser tabs to find it.