Monitor, Debug & Audit Your Valkey Database
Know why it was slow, who accessed what, and what to fix—with data that persists beyond the moment. Redis-compatible.
Or self-host:
docker pull betterdb/monitor
docker run -d \
  --name betterdb \
  -p 3001:3001 \
  -e DB_HOST=your-valkey-host \  # optional
  -e DB_PORT=6379 \              # optional
  -e BETTERDB_LICENSE_KEY=beta \
  betterdb/monitor:latest
Then open http://localhost:3001
See what's actually happening inside your Valkey instance
Historical data that survives a log rotation. Client-level attribution. Automatic anomaly detection.
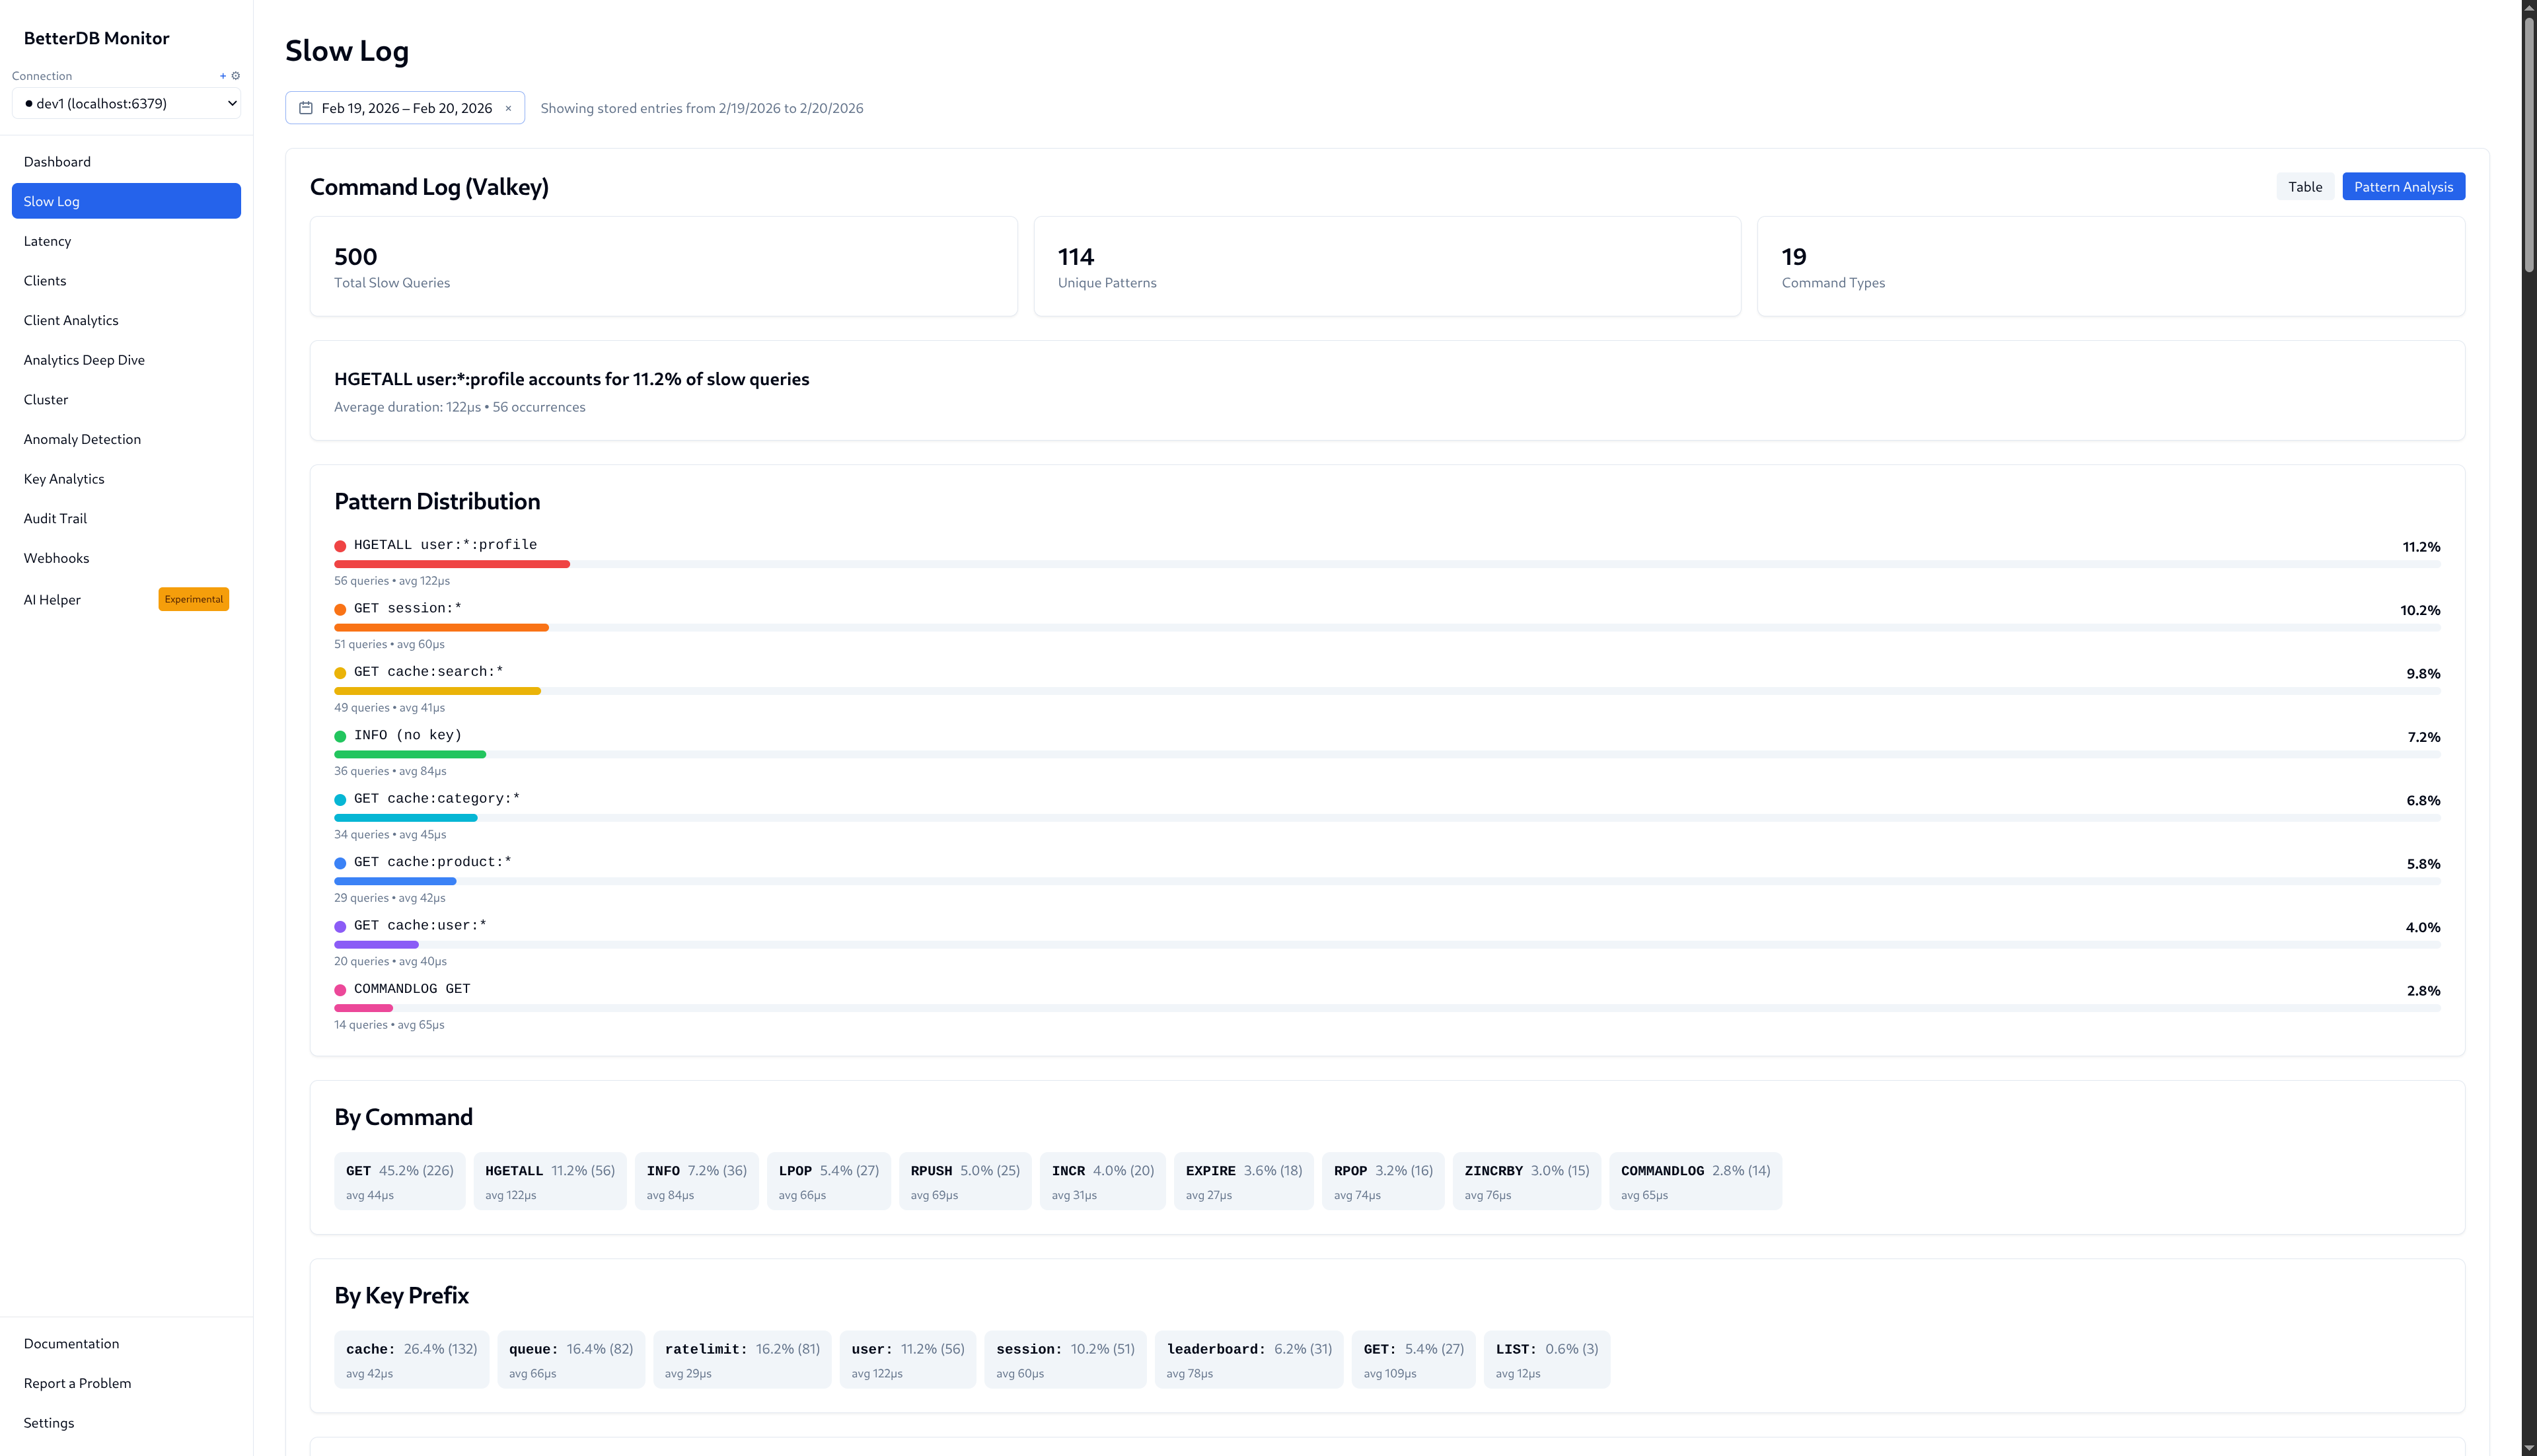
500 slow queries, 114 unique patterns, 19 command types — across any historical time range. The evidence that used to disappear after a log rotation.
Launch Special — Use license key beta for full Pro features
Everything you need to understand your Valkey instance
Deep insights into your Valkey deployment with minimal overhead.
COMMANDLOG Support
Valkey 8.1+ exclusive. See every command executed, not just slow ones.
Anomaly Detection
Automatic detection of unusual patterns across memory, CPU, and connections.
Historical Analytics
Query what happened at 3am, not just what's happening now.
Cluster Visualization
Interactive topology graphs, slot heatmaps, and migration tracking.
ACL Audit Trail
Track who accessed what for compliance and debugging.
Slowlog Patterns
See that GET user:* is 80% of your slow queries.
Key Analytics
Analyze key patterns by namespace and key type.
Client Analytics
See which clients consume resources. Detect unusual buffer sizes and connection spikes.
Prometheus & Webhooks
99 Prometheus metrics plus Slack, email, and webhook notifications.
AI Assistant
Ask questions about your Valkey instance in plain English.
BetterDB Cloud is here
Fully managed monitoring — no infrastructure to maintain. Team collaboration, agent-based monitoring for private databases, and more.
Get Started FreeReady to get started?
Start monitoring in minutes with BetterDB Cloud. Or self-host — open source core, zero lock-in.